Coronavirus (COVID-19) Deaths
This page provides data on the number of confirmed deaths from COVID-19.
Research has shown that these figures are an underestimate of the total pandemic death toll. This is because of limited testing, poorly functioning death registries, challenges in determining the cause of death, and disruptions during the pandemic.
We therefore also provide data on “excess mortality” across the world here:
Related articles:
- How do death rates from COVID-19 differ between people who are vaccinated and those who are not?
- Why do COVID-19 deaths in Sweden's official data always appear to decrease?
Explore the global data on confirmed COVID-19 deaths
Confirmed deaths
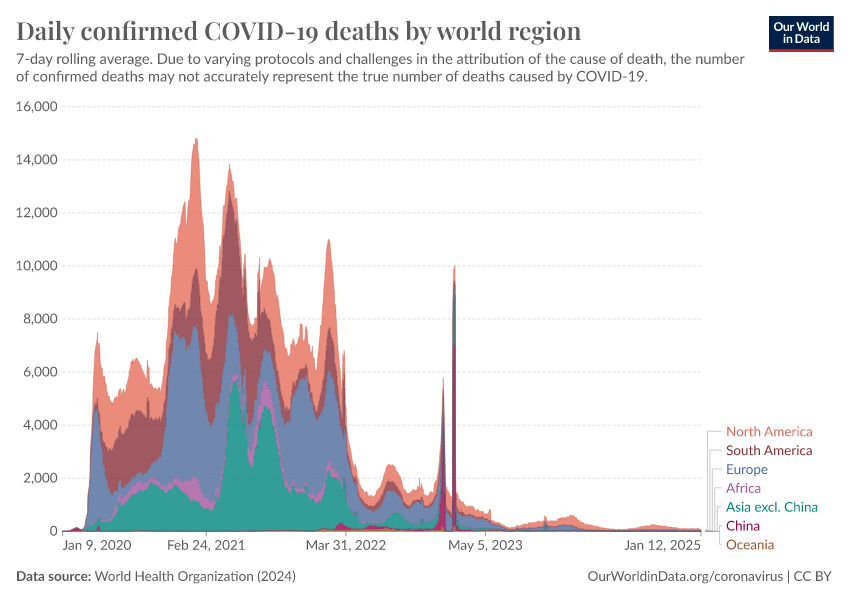
What is the daily number of confirmed deaths?
This chart shows the number of confirmed COVID-19 deaths per day.
Three points to keep in mind about confirmed death figures
- The actual death toll from COVID-19 is likely to be higher than the number of confirmed deaths – this is due to limited testing, poorly functioning death registries, challenges in determining the cause of death, and disruptions during the pandemic. The difference between reported confirmed deaths and actual deaths varies between countries.
- COVID-19 deaths may be recorded in different ways between countries (e.g., some countries may only count hospital deaths, whilst others also include deaths in homes).
- The death figures on a given date do not necessarily show the number of new deaths on that day, but the deaths reported on that day. Since reporting is delayed and the levels of reporting can vary between days, such as on weekends, regardless of any actual variation of deaths, it is more helpful to view the seven-day rolling average of the daily figures as we do in the chart here.
We provide more detail on these points in the section 'Deaths from COVID-19: background'.
Three tips on how to interact with this chart
- By clicking on ‘Edit countries and regions’, you can show and compare the data for any country in the world you are interested in.
- If you click on the title of the chart, the chart will open in a new tab. You can then copy-paste the URL and share it.
- Map view: switch to a global map of confirmed deaths by clicking the ‘Map’ button at the top of the chart.
Related charts:
Weekly confirmed deaths per million people

There are often very large differences in the population size of different countries – it is therefore more insightful to compare the number of confirmed deaths as a rate per million people.
Keep in mind that some countries have limited testing and medical records, and/or poorly functioning death registries, so the actual number of deaths can be much higher than the number of confirmed deaths shown here.
Three tips on how to interact with this map
- By clicking on any country on the map you can see the change over time in this country.
- By moving the time slider (below the map) you can see how the global situation has changed over time.
- You can focus on a particular world region by using the dropdown menu at the top-right of the map.
What is the cumulative number of confirmed deaths?
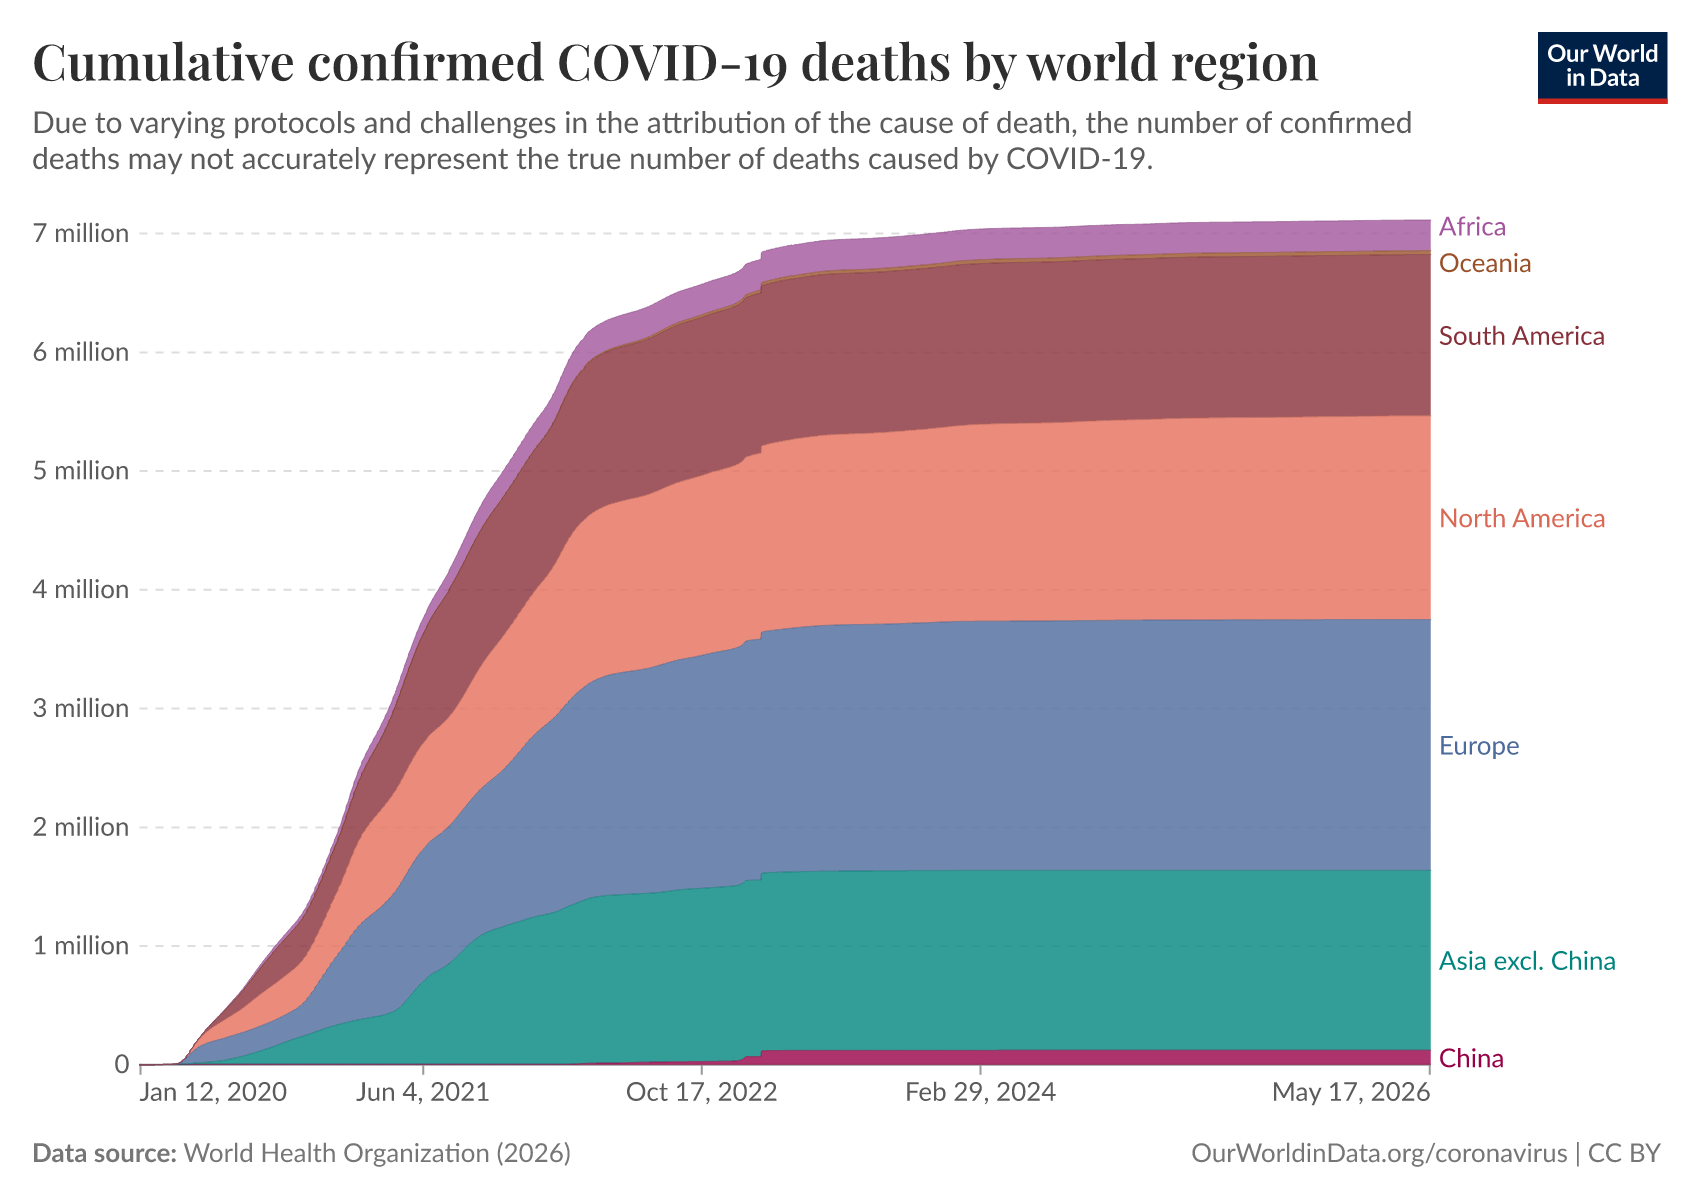
Keep in mind that some countries have limited testing and medical records, and/or poorly functioning death registries, so the actual number of deaths can be much higher than the number of confirmed deaths shown here.
Related charts:


Weekly and biweekly deaths: where are confirmed deaths increasing or falling?
Why is it useful to look at weekly or biweekly changes in confirmed deaths?
For all global data sources on the pandemic, daily data does not necessarily refer to the number of new confirmed deaths on that day – but to the deaths reported on that day.
Since reporting can vary very significantly from day to day – regardless of any actual variation of deaths – it is helpful to look at changes from week to week. This provides a slightly clearer picture of where the outbreak has been growing, slowing, or in fact shrinking.
The first set of maps shows figures on weekly and biweekly confirmed deaths.
The weekly number is a sum of the number of confirmed deaths over a 7-day period, while the biweekly number shows deaths over a 14-day period.
The second set of maps shows the growth rate over this period.
Three tips on how to interact with these maps
- By clicking on any country on the map you see the change over time in this country.
- By moving the time slider (below the map) you can see how the global situation has changed over time.
- You can focus on a particular world region using the dropdown menu at the top-right of the map.


Confirmed deaths and cases: our data source
Our World in Data relies on data from the World Health Organization
In this document, the many linked charts, our COVID-19 Data Explorer, and the Complete COVID-19 dataset, we report and visualize the data on confirmed cases and deaths from the World Health Organization (WHO). We make the data in our charts and tables downloadable as complete and structured CSV, XLSX, and JSON files on GitHub.
The WHO has published updates on confirmed cases and deaths on its dashboard for all countries since 31 December 2019. From 31 December 2019 to 21 March 2020, this data was sourced through official communications under the International Health Regulations (IHR, 2005), complemented by publications on official ministries of health websites and social media accounts. Since 22 March 2020, the data has been compiled through WHO region-specific dashboards or direct reporting to WHO.
The WHO updates its data once per week.
Deaths of COVID-19: background
How are causes of death determined and reported in general?
In many richer countries, the vast majority of deaths are reported with an ‘underlying cause of death’ listed on their death certificate.
Determining this underlying cause is challenging in many cases. Health problems are often connected and can interact, meaning that multiple conditions can ultimately result in death. Or one underlying condition can result in multiple complications, and each can trigger death.
Health or legal professionals are responsible for filling out a death certificate. To do this, they determine the chain of events that led to the death using medical records, circumstances, national guidelines, and other knowledge. They can write up to four steps in the chain leading to death and should use as precise language as possible, but can mention if they believe a cause is ‘probable’.
Hospitals or health departments then collect data from death certificates, which are compiled by the country’s national vital registry. The ‘underlying cause’, listed in the last step of the chain, is converted into a death code. Countries may have slightly different procedures for precisely converting which death codes; for example, they may use additional information about each deceased person.
The death codes follow the classifications in the International Classification of Diseases (ICD) guidelines.
This data is then submitted to the WHO annually. It tends to be delayed as it takes time for health or legal professionals to determine the causes of deaths, especially sudden or unexpected deaths, and for departments to compile this data from across the nation.
In poorer countries, this process may be limited or lacking because of a lack of medical testing and records, health and legal professionals, hospitals, and vital registries.
You can read more in our article:
How are COVID-19 deaths determined and reported?
The process described above also takes place for deaths caused by COVID-19.
But determining the cause of death for respiratory infections, such as COVID-19, can be complicated because they can lead to a range of complications such as pneumonia, acute respiratory distress syndrome (ARDS), and heart failure.
So, how are deaths from COVID-19 reported? What is and isn’t included in these totals?
As is standard in death reporting, countries are asked to follow the cause of death classifications from the WHO’s International Classification of Diseases guidelines.1 However, countries also typically provide their own guidance to practitioners on how and when COVID-19 deaths should be recorded on a death certificate.
Let’s take a look at two concrete examples of national guidance: the United States’s guidance (in the CDC’s Vital Statistics reporting guidance, published 2023) and the United Kingdom’s guidance (in the Office for National Statistics’s guidance, published 2022). Both provide very similar guidelines for medical practitioners on the completion of death certificates.2
Both guidelines state that if the practitioner suspects that COVID-19 played a role in an individual’s death, it should be specified on the death certificate. In some cases, COVID-19 may be the underlying cause of death, having led to complications such as pneumonia or ARDS, so COVID-19 should be listed.3
Although confirmed cases are reliant on a positive laboratory confirmation of the COVID-19 test, a laboratory diagnosis may not be required for it to be listed as the cause of death.
The UK’s guidelines, for example, make clear that practitioners should complete death certificates to the best of their knowledge, stating that “if before death the patient had symptoms typical of COVID-19 infection, but the test result has not been received, it would be satisfactory to give ‘COVID-19’ as the cause of death, and then share the test result when it becomes available. In the circumstances of there being no swab, it is satisfactory to apply clinical judgement.”
This means a positive COVID-19 test result is not required for a death to be registered as COVID-19. In some circumstances, depending on national guidelines, medical practitioners can record COVID-19 deaths if they think the signs and symptoms point towards this as the underlying cause.
The US CDC’s guidelines also make this clear with an example: the death of an 86-year-old female with an unconfirmed case of COVID-19. It was reported that the woman had typical COVID-19 symptoms five days prior to suffering an ischemic stroke at home. Despite not being tested for COVID-19, the coroner determined that the likely underlying cause of death was COVID-19 given her symptoms and exposure to an infected individual.
Why are there delays in death reports?
Just as with confirmed cases, the number of deaths reported on a given day does not necessarily reflect the actual number of COVID-19 deaths on that day, or in the previous 24 hours.
This is due to lags and delays in reporting.
Delays can occur for several reasons:
- After a death certificate has been completed, there may be a post-mortem or laboratory testing to verify the cause of death.
- Death certificates are then either automatically or manually coded. It may be the case that COVID-19 deaths are manually coded.
- This coding process may involve significant delays, especially if the number of deaths increases significantly.
- These figures are then collected in national registration statistics and reported to international sources.
The delay in reporting can take days, sometimes a week or more. This means the number of deaths reported on a given day does not reflect the actual number of deaths that occurred on that day.
Actual death figures are likely to be higher than confirmed deaths
The number of confirmed deaths may not be an accurate count of the actual number of deaths from COVID-19, because of limited testing and medical records, poorly functioning vital registries, challenges in determining the cause of death, and delays in reporting.
In an ongoing outbreak, we do not know the final outcomes – death or recovery – for all cases.
Among those who die from COVID-19, it typically takes 2 to 8 weeks between the onset of symptoms and death.4 This means that some people who are currently infected with COVID-19 will die at a later date. This needs to be kept in mind when comparing the current number of deaths with the current number of cases.
What does the data on deaths and cases tell us about the mortality risk of COVID-19?
To understand the risks and respond appropriately, we would also want to know the mortality risk of COVID-19, in other words, the risk that someone infected with the disease will die from it.
We look into this question in more detail on our page about the mortality risk of COVID-19.
Acknowledgments
We are grateful to everyone whose editorial review and expert feedback on this work helped us to continuously improve our work on the pandemic.
We would like to acknowledge and thank a number of people in the development of this work: Carl Bergstrom, Bernadeta Dadonaite, Natalie Dean, Joel Hellewell, Jason Hendry, Adam Kucharski, Moritz Kraemer, and Eric Topol for their very helpful and detailed comments and suggestions on earlier versions of this work. We thank Tom Chivers for his editorial review and feedback.
And we would like to thank the many hundreds of readers who give us feedback on this work. Your feedback is what allows us to continuously clarify and improve it. We very much appreciate you taking the time to write. We cannot respond to every message we receive, but we do read all feedback and aim to take the many helpful ideas into account.
Our work belongs to everyone
Download the complete Our World in Data COVID-19 dataset
- All our code is open-source
- All our research and visualizations are free for everyone to use for all purposes
Endnotes
World Health Organization. International statistical classification of diseases and related health problems, 10th revision (ICD–10), Volume 2. 5th ed. Geneva, Switzerland. 2016.
National Center for Health Statistics. Guidance for certifying deaths due to COVID-19. Hyattsville, MD. 2020.
The WHO, in its ICD documentation, defines the underlying cause of death as “a) the disease or injury which initiated the train of morbid events leading directly to death, or b) the circumstances of the accident or violence which produced the fatal injury.”
World Health Organization (2020). Report of the WHO-China Joint Mission on Coronavirus Disease 2019 (COVID-19). Available online.
Cite this work
Our articles and data visualizations rely on work from many different people and organizations. When citing this article, please also cite the underlying data sources. This article can be cited as:
Edouard Mathieu, Hannah Ritchie, Lucas Rodés-Guirao, Cameron Appel, Daniel Gavrilov, Charlie Giattino, Joe Hasell, Bobbie Macdonald, Saloni Dattani, Diana Beltekian, Esteban Ortiz-Ospina, and Max Roser (2020) - “Coronavirus (COVID-19) Deaths” Published online at OurWorldinData.org. Retrieved from: 'https://archive.ourworldindata.org/20260716-164845/covid-deaths.html' [Online Resource] (archived on July 16, 2026).BibTeX citation
@article{owid-covid-deaths,
    author = {Edouard Mathieu and Hannah Ritchie and Lucas Rodés-Guirao and Cameron Appel and Daniel Gavrilov and Charlie Giattino and Joe Hasell and Bobbie Macdonald and Saloni Dattani and Diana Beltekian and Esteban Ortiz-Ospina and Max Roser},
    title = {Coronavirus (COVID-19) Deaths},
    journal = {Our World in Data},
    year = {2020},
    note = {https://archive.ourworldindata.org/20260716-164845/covid-deaths.html}
}
Reuse this work freely
All visualizations, data, and articles produced by Our World in Data are completely open access under the Creative Commons BY license. You have the permission to use, distribute, and reproduce these in any medium, provided the source and authors are credited.
The data produced by third parties and made available by Our World in Data is subject to the license terms from the original third-party authors. We will always indicate the original source of the data in our documentation, so you should always check the license of any such third-party data before use and redistribution.
All of our charts can be embedded in any site.