


How does food get traded around the world?
Our interactive tool helps you see where food is exported from and where it goes.
June 29, 2026
For many of us, our local supermarkets are full of foods that were grown and produced elsewhere: bananas from South America, cocoa beans from West Africa, and citrus fruits from Southern Europe. This is the case in many parts of the world. Our food systems have become incredibly globalized.
Which countries do we depend on for this wide range of foods?
To see how and where food is traded across the world, we built this interactive visualization. It shows the flow of different types of food from producer to consumer.
The first view of this visualization shows how maize (or corn) was traded across the world.
On the left-hand side, we have the exporting countries, and on the right, we see where they sent it. Brazil and the United States were the largest exporters. China was the largest importer.
Using the first dropdown, you can look at trade for many different types of food. Using the second, you can focus on trade in and out of any country you’re interested in.
A note on methodology
Our tool is built from country-to-country trade data from the Food and Agriculture Organization of the United Nations.
What we found when digging into this data is that what exporting countries say they’ve exported to a given country doesn’t always match what the receiving country says they’ve imported. This is a common issue for all trade data, not just food.
To keep things balanced, we prioritize data reported by the importing country. Pablo Rosado explains in more detail in our technical documentation.
A walkthrough of how to explore the tool
Sankey diagrams are an unusual visualization type. So if the tool above doesn’t quite make sense to you, let us walk you through it so you can see the different data views available.
We’ll take one specific example: soybeans.
Below, you can see both exports and imports of soybeans into the United States. On the left, you can see that it imports hardly anything. On the right, you can see that it exports a lot.
If we want to focus only on what the United States exports, we can narrow it to the export view. That’s shown below.
As you can see, China is the US’s largest soybean export market. More than half of its exports go there.
That raises the question: how dependent is China on soybean imports to meet its domestic demand? And which countries does it rely on; does the US play a big or small role in its import market?
By looking at soybean imports in China, we get the answers. Imported soybeans make up most of its domestic supply. And while the US is a significant exporter, it’s far smaller than Brazil. Almost 70% of its imported soybeans came from there, compared to just one-quarter from the United States.
Global Food
Explore the world's food system, from production to supply.
Agricultural Production
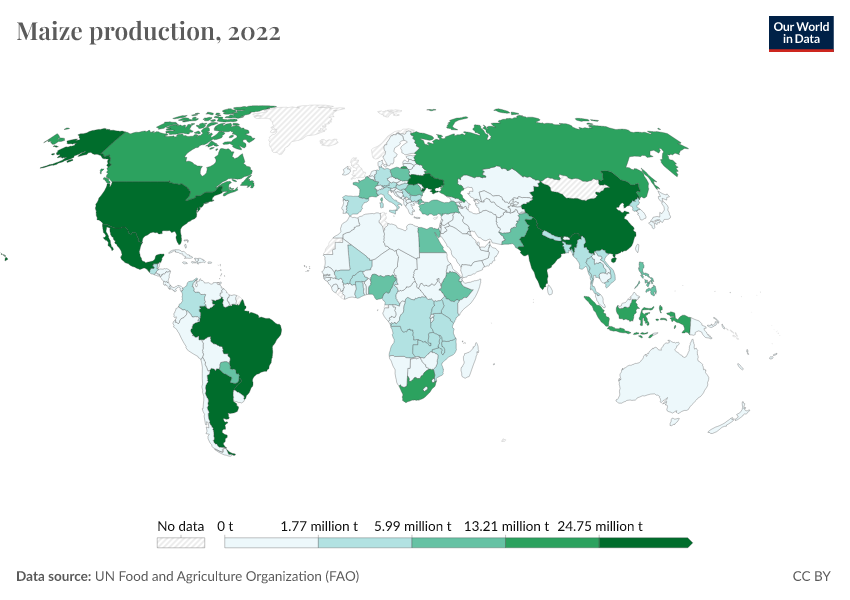
How much, and what types of food, do countries produce across the world?
Beef production in Brazil has been the largest driver of global deforestation in recent decades
Most beef production in Brazil is to meet domestic rather than international demand.
Contributors & acknowledgements
By Hannah Ritchie, Pablo Rosado, and Sophia Mersmann.
With contributions from Marwa Boukarim.
Hannah Ritchie worked on the original concept for this project, and wrote the text. Pablo Rosado prepared the data. Sophia Mersmann built the visualization. Marwa Boukarim provided input on its design.
Many thanks to Marcel Gerber, Pablo Arriagada, Max Roser and Edouard Mathieu for their comments and suggestions on this project.
Cite this work
Our articles and data visualizations rely on work from many different people and organizations. When citing this page, please also cite the underlying data sources. This page can be cited as:
Hannah Ritchie, Pablo Rosado, and Sophia Mersmann (2026) - “How does food get traded around the world?” Published online at OurWorldinData.org. Retrieved from: 'https://ourworldindata.org/featured-viz/how-does-food-get-traded-around-the-world' [Online Resource]BibTeX citation
@article{owid-how-does-food-get-traded-around-the-world,
    author = {Hannah Ritchie and Pablo Rosado and Sophia Mersmann},
    title = {How does food get traded around the world?},
    journal = {Our World in Data},
    year = {2026},
    note = {https://ourworldindata.org/featured-viz/how-does-food-get-traded-around-the-world}
}
Reuse this work freely
All visualizations, data, and articles produced by Our World in Data are completely open access under the Creative Commons BY license. You have the permission to use, distribute, and reproduce these in any medium, provided the source and authors are credited.
The data produced by third parties and made available by Our World in Data is subject to the license terms from the original third-party authors. We will always indicate the original source of the data in our documentation, so you should always check the license of any such third-party data before use and redistribution.
All of our charts can be embedded in any site.