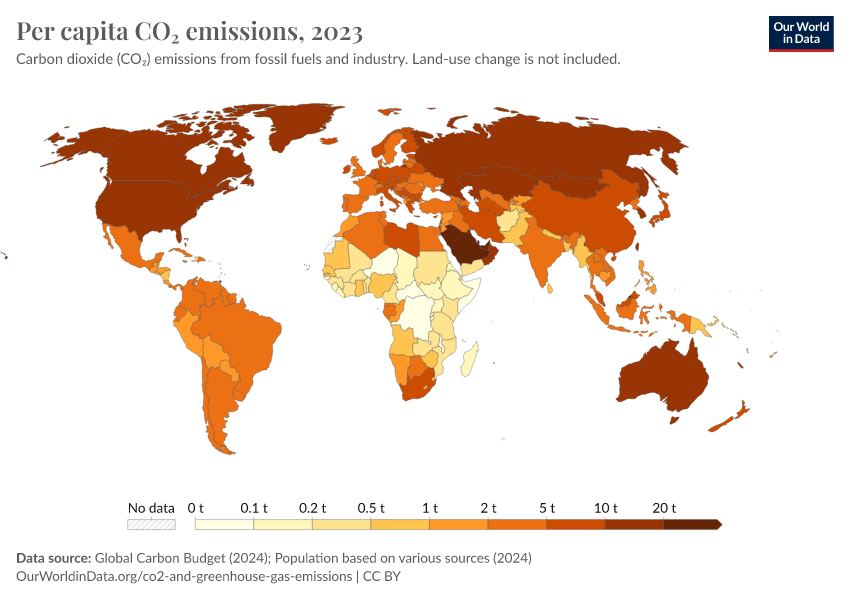
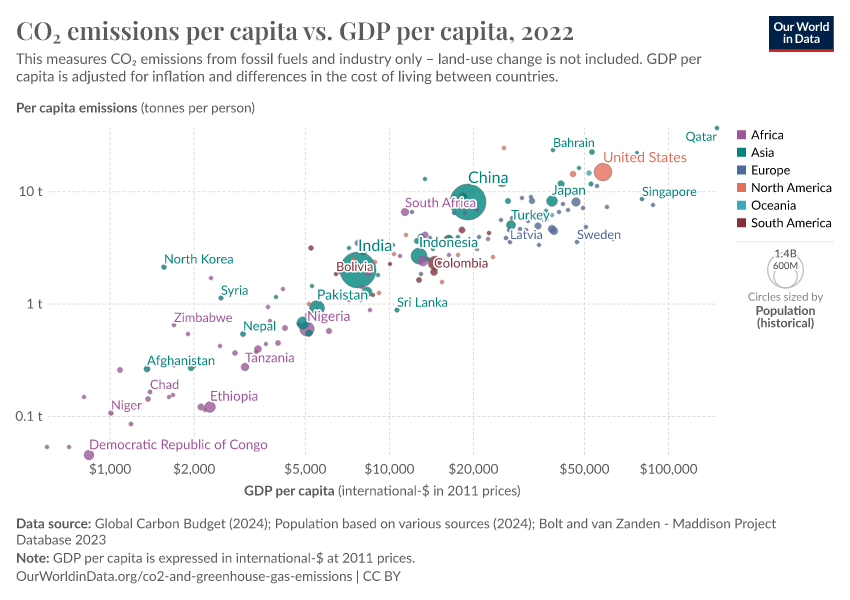
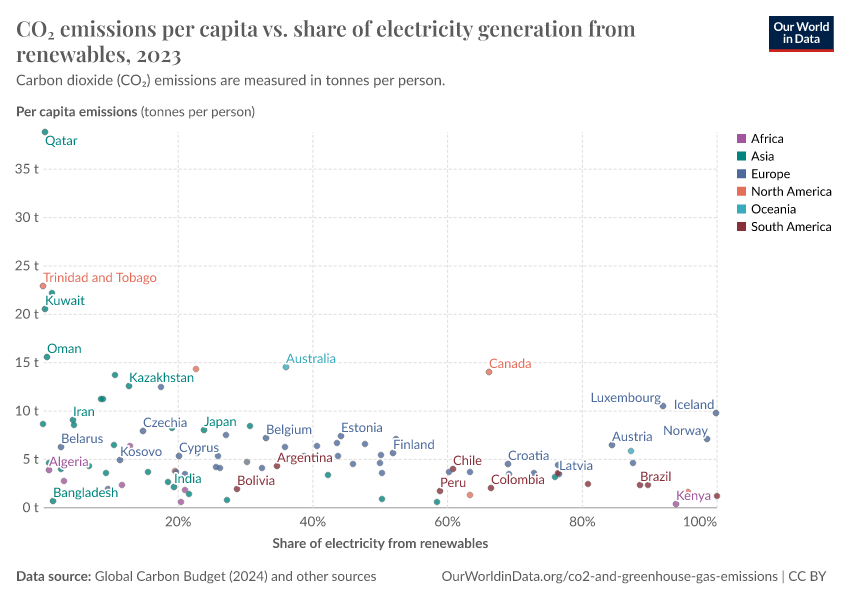
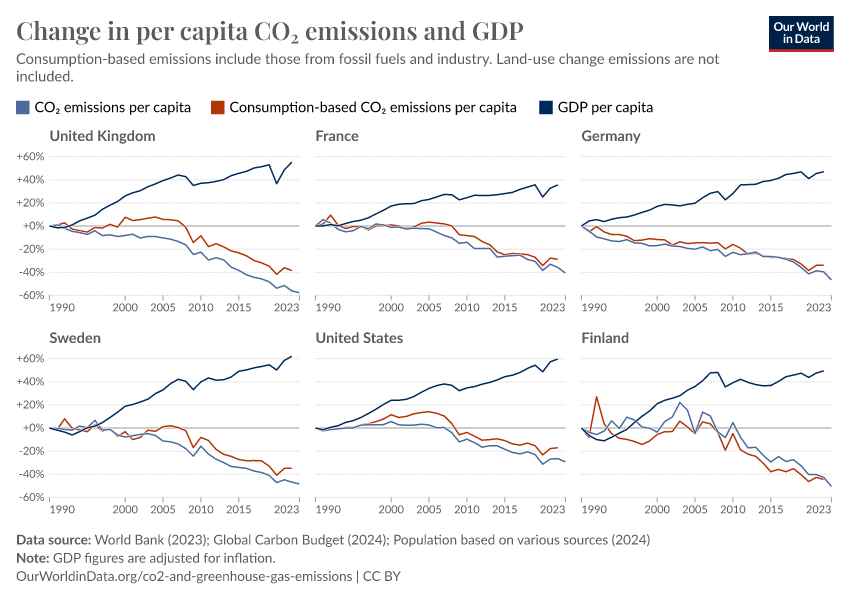
CO₂ emissions per capita, 2023

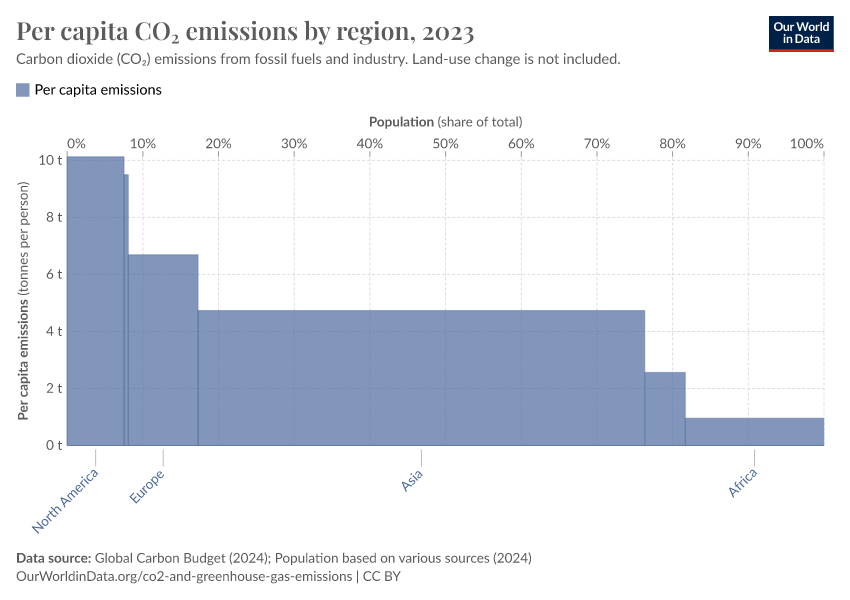
The width of each bar shows countries scaled by population size. The height of each bar measures tonnes of per capita carbon dioxide (CO₂) emissions fromfossil fuels and industry.

Country/area
Per capita emissions
tonnes per person 2023
Population (historical)
people 2023
World regions according to OWID
2023
Afghanistan0.27 t41,454,762Asia
Aland IslandsEurope
Albania1.83 t2,811,660Europe
Algeria3.86 t46,164,221Africa
American Samoa47,543Oceania
Andorra5.24 t80,868Europe
Angola0.57 t36,749,907Africa
Anguilla10.01 t14,435North America
Antigua and Barbuda6.91 t93,333North America
Argentina4.30 t45,538,402South America
Armenia2.58 t2,943,395Asia
Aruba8.03 t107,946North America
Australia14.48 t26,451,125Oceania
Austria6.42 t9,130,434Europe
Austria-HungaryEurope
Azerbaijan4.26 t10,318,210Asia
Bahamas6.27 t399,452North America
Bahrain23.27 t1,569,674Asia
Bangladesh0.66 t171,466,986Asia
Barbados4.22 t282,348North America
Belarus6.20 t9,115,680Europe
Belgium7.12 t11,712,894Europe
Belize1.62 t411,115North America
Benin0.40 t14,111,035Africa
Bermuda8.07 t64,721North America
Bhutan2.18 t786,387Asia
Bolivia1.91 t12,244,161South America
Bonaire Sint Eustatius and Saba3.84 t29,919North America
Bosnia and Herzegovina6.34 t3,185,071Europe
Botswana2.71 t2,480,242Africa
Brazil2.30 t211,140,731South America
British Indian Ocean TerritoryAsia
British Virgin Islands4.75 t39,008North America
Brunei25.64 t458,959Asia
Bulgaria5.31 t6,795,804Europe
Burkina Faso0.27 t23,025,778Africa
Burundi0.05 t13,689,455Africa
Cambodia1.16 t17,423,881Asia
Cameroon0.35 t28,372,688Africa
Canada13.98 t39,299,099North America
Cape Verde1.02 t522,335Africa
Cayman Islands73,055North America
Central African Republic0.05 t5,152,417Africa
Chad0.16 t19,319,073Africa
Chile3.93 t19,658,834South America
China8.37 t1,422,584,937Asia
Christmas IslandAsia
Cocos IslandsAsia
Colombia2.01 t52,321,152South America
Comoros0.53 t850,390Africa
Congo1.24 t6,182,889Africa
Cook Islands5.11 t14,243Oceania
Costa Rica1.62 t5,105,527North America
Cote d'Ivoire0.42 t31,165,651Africa
Croatia4.50 t3,896,024Europe
Cuba2.10 t11,019,931North America
Curacao10.91 t185,437North America
Cyprus5.33 t1,344,979Europe
Czechia7.92 t10,809,722Europe
CzechoslovakiaEurope
Democratic Republic of Congo0.04 t105,789,733Africa
Democratic Republic of VietnamAsia
Denmark4.58 t5,948,134Europe
Djibouti0.43 t1,152,951Africa
Dominica2.45 t66,531North America
Dominican Republic2.83 t11,331,268North America
Duchy of Modena and ReggioEurope
Duchy of Parma and PiacenzaEurope
East GermanyEurope
East Timor0.46 t1,384,292Asia
Ecuador2.40 t17,980,079South America
Egypt2.35 t114,535,772Africa
El Salvador1.30 t6,309,628North America
Equatorial Guinea3.32 t1,847,556Africa
Eritrea0.18 t3,470,392Africa
Estonia7.33 t1,367,194Europe
Eswatini0.90 t1,230,508Africa
Ethiopia0.12 t128,691,696Africa
Ethiopia (former)Africa
Falkland Islands3,498South America
Faroe Islands14.57 t54,738Europe
Federal Republic of Central AmericaNorth America
Fiji1.24 t924,150Oceania
Finland5.65 t5,601,185Europe
France4.10 t66,438,828Europe
French Guiana303,409South America
French Polynesia3.26 t281,124Oceania
Gabon2.18 t2,484,790Africa
Gambia0.26 t2,697,848Africa
Georgia3.09 t3,807,494Asia
Germany7.05 t84,548,234Europe
Ghana0.58 t33,787,915Africa
Gibraltar38,493Europe
Grand Duchy of BadenEurope
Grand Duchy of TuscanyEurope
Great ColombiaSouth America
Greece5.39 t10,242,909Europe
Greenland10.66 t55,951North America
Grenada2.90 t117,093North America
Guadeloupe376,519North America
Guam166,523Oceania
Guatemala1.12 t18,124,842North America
Guernsey64,042Europe
Guinea0.28 t14,405,469Africa
Guinea-Bissau0.14 t2,153,344Africa
Guyana4.29 t826,360South America
Haiti0.30 t11,637,402North America
Honduras1.04 t10,644,855North America
Hong Kong4.55 t7,442,738Asia
Hungary4.15 t9,686,463Europe
Iceland9.71 t387,559Europe
India2.13 t1,438,069,597Asia
Indonesia2.61 t281,190,068Asia
Iran9.03 t90,608,708Asia
Iraq3.91 t45,074,055Asia
Ireland6.63 t5,196,629Europe
Isle of Man84,180Europe
Israel6.43 t9,256,311Asia
Italy5.27 t59,499,452Europe
Jamaica2.69 t2,839,785North America
Japan7.95 t124,370,947Asia
Jersey103,679Europe
Jordan1.85 t11,439,219Asia
Kazakhstan12.55 t20,330,106Asia
Kenya0.39 t55,339,007Africa
Kingdom of BavariaEurope
Kingdom of SardiniaEurope
Kingdom of SaxonyEurope
Kingdom of WurttembergEurope
Kingdom of the Two SiciliesEurope
Kiribati0.52 t132,539Oceania
Korea (former)Asia
Kosovo4.93 t1,700,039Europe
Kuwait20.51 t4,838,780Asia
Kyrgyzstan1.44 t7,073,523Asia
Laos3.24 t7,665,002Asia
Latvia3.46 t1,882,400Europe
Lebanon3.37 t5,773,492Asia
Lesotho1.68 t2,311,476Africa
Liberia0.14 t5,493,034Africa
Libya8.35 t7,305,660Africa
Liechtenstein3.97 t39,621Europe
Lithuania4.37 t2,854,105Europe
Luxembourg10.51 t665,101Europe
Macao1.48 t713,916Asia
Madagascar0.14 t31,195,936Africa
Malawi0.08 t21,104,480Africa
Malaysia8.22 t35,126,295Asia
Maldives3.92 t526,009Asia
Mali0.28 t23,769,129Africa
Malta3.42 t532,964Europe
Marshall Islands3.95 t38,849Oceania
Martinique346,008North America
Mauritania0.88 t5,022,440Africa
Mauritius3.25 t1,273,590Africa
Mayotte316,028Africa
Mexico3.72 t129,739,764North America
Micronesia (country)1.33 t112,646Oceania
Moldova1.94 t3,067,071Europe
Monaco38,978Europe
Mongolia13.66 t3,431,939Asia
Montenegro3.68 t633,557Europe
Montserrat5.01 t4,440North America
Morocco1.82 t37,712,517Africa
Mozambique0.24 t33,635,165Africa
Myanmar0.56 t54,133,801Asia
Namibia1.41 t2,963,101Africa
Nauru4.83 t11,900Oceania
Nepal0.56 t29,694,614Asia
Netherlands6.56 t18,092,525Europe
Netherlands AntillesNorth America
New Caledonia17.48 t289,880Oceania
New Zealand5.82 t5,172,839Oceania
Nicaragua0.82 t6,823,618North America
Niger0.10 t26,159,862Africa
Nigeria0.56 t227,882,949Africa
Niue4.16 t1,841Oceania
Norfolk IslandOceania
North Korea2.30 t26,418,196Asia
North Macedonia4.07 t1,831,800Europe
Northern Mariana Islands45,165Oceania
Norway7.05 t5,519,166Europe
Oman15.55 t5,049,268Asia
Orange Free StateAfrica
Pakistan0.81 t247,504,504Asia
Pakistan (former)Asia
Palau12.53 t17,750Oceania
Palestine0.65 t5,409,201Asia
Panama3.14 t4,458,759North America
Papua New Guinea0.80 t10,389,638Oceania
Paraguay1.19 t6,844,152South America
Peru1.65 t33,845,617South America
Philippines1.35 t114,891,200Asia
PitcairnOceania
Poland7.46 t38,762,847Europe
Portugal3.57 t10,430,735Europe
Puerto Rico3,242,023North America
Qatar38.84 t2,979,087Asia
Republic of VietnamAsia
Reunion874,883Africa
Romania3.57 t19,118,481Europe
Russia12.49 t145,440,504Europe
Rwanda0.11 t13,954,474Africa
Saint Barthelemy11,112North America
Saint Helena2.09 t5,316Africa
Saint Kitts and Nevis4.99 t46,783North America
Saint Lucia2.85 t179,293North America
Saint Martin (French part)27,545North America
Saint Pierre and Miquelon9.74 t5,707North America
Saint Vincent and the Grenadines2.34 t101,331North America
Samoa1.19 t216,674Oceania
San Marino33,761Europe
Sao Tome and Principe0.72 t230,881Africa
Saudi Arabia22.13 t33,264,288Asia
Senegal0.66 t18,077,573Africa
Serbia6.25 t6,773,203Europe
Serbia and MontenegroEurope
Seychelles4.31 t127,961Africa
Sierra Leone0.15 t8,460,523Africa
Singapore8.51 t5,789,091Asia
Sint Maarten (Dutch part)16.20 t42,775North America
Slovakia5.57 t5,518,057Europe
Slovenia5.35 t2,118,395Europe
Solomon Islands0.38 t800,013Oceania
Somalia0.03 t18,358,621Africa
South Africa6.36 t63,212,386Africa
South Georgia and the South Sandwich IslandsSouth America
South Korea11.16 t51,748,744Asia
South Sudan0.14 t11,483,373Africa
Spain4.63 t47,911,583Europe
Sri Lanka0.88 t22,971,616Asia
Sudan0.40 t50,042,799Africa
Suriname4.21 t628,892South America
Sweden3.46 t10,551,493Europe
Switzerland3.69 t8,870,564Europe
Syria1.08 t23,594,622Asia
Taiwan11.20 t23,317,145Asia
Tajikistan0.87 t10,389,808Asia
Tanzania0.27 t66,617,607Africa
Thailand3.69 t71,702,438Asia
Togo0.28 t9,304,344Africa
Tokelau2,424Oceania
Tonga1.91 t104,614Oceania
Trinidad and Tobago22.83 t1,502,936North America
Tunisia2.69 t12,200,434Africa
Turkey4.95 t87,270,503Asia
Turkmenistan8.60 t7,364,437Asia
Turks and Caicos Islands8.02 t46,219North America
Tuvalu1.17 t9,837Oceania
USSREurope
Uganda0.12 t48,656,604Africa
Ukraine3.62 t37,732,832Europe
United Arab Emirates21.55 t10,642,089Asia
United Kingdom4.44 t68,682,965Europe
United States14.30 t343,477,332North America
United States Virgin Islands85,712North America
Uruguay2.32 t3,388,083South America
Uzbekistan3.50 t35,652,309Asia
Vanuatu0.71 t320,422Oceania
Vatican501Europe
Venezuela3.52 t28,300,860South America
Vietnam3.34 t100,352,189Asia
Wallis and Futuna2.69 t11,394Oceania
West GermanyEurope
Western Sahara579,735Africa
Yemen0.25 t39,390,800Asia
Yemen Arab RepublicAsia
Yemen People's RepublicAsia
YugoslaviaEurope
Zambia0.37 t20,723,968Africa
Zimbabwe0.68 t16,340,829Africa
Other
Africa0.96 t1,480,770,740
Africa (UN)1,480,770,527
Akrotiri and Dhekelia
Americas (UN)1,041,794,259
Asia4.73 t4,776,659,632
Asia (UN)4,778,004,495
Asia (excl. China and India)3.99 t1,839,126,400
Europe6.69 t746,948,103
Europe (UN)745,602,869
Europe (excl. EU-27)8.39 t
Europe (excl. EU-28)9.58 t
Europe (excl. Russia)609,583,296
European Union (27)5.57 t450,657,571
European Union (28)5.42 t
High-income countries9.96 t1,259,131,468
Latin America and the Caribbean (UN)658,891,516
Low-income countries0.27 t736,466,460
Lower-middle-income countries1.58 t3,253,459,279
North America10.13 t608,770,557
North America (excl. USA)4.64 t
Northern America (UN)382,902,740
Oceania9.50 t45,563,133
Oceania (UN)45,562,792
South America2.56 t433,024,230
South America (excl. Brazil)224,571,280
Svalbard and Jan Mayen2,400
Upper-middle-income countries6.15 t2,839,926,083
World4.67 t8,091,734,935
Data

CO₂ emissions per capita

GCB
See all data and research on:

What you should know about this indicator

  • Per capita emissions represent the emissions of an average person in a country or region - they are calculated as the total emissions divided by population.
  • This data is based on territorial emissions, which do not account for emissions embedded in traded goods.
  • Emissions from international aviation and shipping are not included in any country or region's emissions. They are only included in the global total emissions.
CO₂ emissions per capita
GCB
Annual total emissions of carbon dioxide (CO₂), excluding land-use change, measured in tonnes per person.
Source
Global Carbon Budget (2024); Population based on various sources (2024) – with major processing by Our World in Data
Last updated
November 21, 2024
Next expected update
November 2025
Date range
1750–2023
Unit
tonnes per person

Sources and processing

This data is based on the following sources

The Global Carbon Budget was founded by the Global Carbon Project (GCP) international science team to track the trends in global carbon emissions and sinks and is a key measure of progress towards the goals of the Paris Agreement. It's widely recognized as the most comprehensive report of its kind.

The GCP has been publishing estimates of global and national fossil CO2 emissions since 2001. In the first instance these were simple re-publications of data from another source, but over subsequent years refinements have been made in response to feedback and identification of inaccuracies.

Retrieved on
November 21, 2024
Citation
This is the citation of the original data obtained from the source, prior to any processing or adaptation by Our World in Data. To cite data downloaded from this page, please use the suggested citation given in Reuse This Work below.
Andrew, R. M., & Peters, G. P. (2024). The Global Carbon Project's fossil CO2 emissions dataset (2024v17) [Data set]. Zenodo. https://doi.org/10.5281/zenodo.13981696
The data files of the Global Carbon Budget can be found at: https://globalcarbonbudget.org/carbonbudget/
For more details, see the original paper:
Friedlingstein, P., O'Sullivan, M., Jones, M. W., Andrew, R. M., Bakker, D. C. E., Hauck, J., Landschützer, P., Le Quéré, C., Luijkx, I. T., Peters, G. P., Peters, W., Pongratz, J., Schwingshackl, C., Sitch, S., Canadell, J. G., Ciais, P., Jackson, R. B., Alin, S. R., Anthoni, P., Barbero, L., Bates, N. R., Becker, M., Bellouin, N., Decharme, B., Bopp, L., Brasika, I. B. M., Cadule, P., Chamberlain, M. A., Chandra, N., Chau, T.-T.-T., Chevallier, F., Chini, L. P., Cronin, M., Dou, X., Enyo, K., Evans, W., Falk, S., Feely, R. A., Feng, L., Ford, D. J., Gasser, T., Ghattas, J., Gkritzalis, T., Grassi, G., Gregor, L., Gruber, N., Gürses, Ö., Harris, I., Hefner, M., Heinke, J., Houghton, R. A., Hurtt, G. C., Iida, Y., Ilyina, T., Jacobson, A. R., Jain, A., Jarníková, T., Jersild, A., Jiang, F., Jin, Z., Joos, F., Kato, E., Keeling, R. F., Kennedy, D., Klein Goldewijk, K., Knauer, J., Korsbakken, J. I., Körtzinger, A., Lan, X., Lefèvre, N., Li, H., Liu, J., Liu, Z., Ma, L., Marland, G., Mayot, N., McGuire, P. C., McKinley, G. A., Meyer, G., Morgan, E. J., Munro, D. R., Nakaoka, S.-I., Niwa, Y., O'Brien, K. M., Olsen, A., Omar, A. M., Ono, T., Paulsen, M., Pierrot, D., Pocock, K., Poulter, B., Powis, C. M., Rehder, G., Resplandy, L., Robertson, E., Rödenbeck, C., Rosan, T. M., Schwinger, J., Séférian, R., Smallman, T. L., Smith, S. M., Sospedra-Alfonso, R., Sun, Q., Sutton, A. J., Sweeney, C., Takao, S., Tans, P. P., Tian, H., Tilbrook, B., Tsujino, H., Tubiello, F., van der Werf, G. R., van Ooijen, E., Wanninkhof, R., Watanabe, M., Wimart-Rousseau, C., Yang, D., Yang, X., Yuan, W., Yue, X., Zaehle, S., Zeng, J., and Zheng, B.: Global Carbon Budget 2023, Earth Syst. Sci. Data, 15, 5301-5369, https://doi.org/10.5194/essd-15-5301-2023, 2023.

Our World in Data builds and maintains a long-run dataset on population by country, region, and for the world, based on various sources.

You can find more information on these sources and how our time series is constructed on this page: https://ourworldindata.org/population-sources

Retrieved on
July 11, 2024
Citation
This is the citation of the original data obtained from the source, prior to any processing or adaptation by Our World in Data. To cite data downloaded from this page, please use the suggested citation given in Reuse This Work below.
The long-run data on population is based on various sources, described on this page: https://ourworldindata.org/population-sources

How we process data at Our World in Data

All data and visualizations on Our World in Data rely on data sourced from one or several original data providers. Preparing this original data involves several processing steps. Depending on the data, this can include standardizing country names and world region definitions, converting units, calculating derived indicators such as per capita measures, as well as adding or adapting metadata such as the name or the description given to an indicator.

At the link below you can find a detailed description of the structure of our data pipeline, including links to all the code used to prepare data across Our World in Data.

Read about our data pipeline
Notes on our processing step for this indicator
  • Data on global emissions has been converted from tonnes of carbon to tonnes of carbon dioxide (CO₂) using a conversion factor of 3.664.
  • Emissions from the Kuwaiti oil fires in 1991 have been included as part of Kuwait's emissions for that year.
  • Country's share of the global population is calculated using our population dataset, based on different sources.
  • Each country's share of global CO₂ emissions from flaring has been calculated using global CO₂ emissions from flaring provided in the Global Carbon Budget dataset.

Reuse this work

  • All data produced by third-party providers and made available by Our World in Data are subject to the license terms from the original providers. Our work would not be possible without the data providers we rely on, so we ask you to always cite them appropriately (see below). This is crucial to allow data providers to continue doing their work, enhancing, maintaining and updating valuable data.
  • All data, visualizations, and code produced by Our World in Data are completely open access under the Creative Commons BY license. You have the permission to use, distribute, and reproduce these in any medium, provided the source and authors are credited.

Citations

How to cite this page

To cite this page overall, including any descriptions, FAQs or explanations of the data authored by Our World in Data, please use the following citation:

“Data Page: CO₂ emissions per capita”, part of the following publication: Hannah Ritchie, Pablo Rosado and Max Roser (2023) - “CO₂ and Greenhouse Gas Emissions”. Data adapted from Global Carbon Project, Various sources. Retrieved from https://ourworldindata.org/grapher/co2-per-capita-marimekko [online resource]
How to cite this data

In-line citationIf you have limited space (e.g. in data visualizations), you can use this abbreviated in-line citation:

Global Carbon Budget (2024); Population based on various sources (2024) – with major processing by Our World in Data

Full citation

Global Carbon Budget (2024); Population based on various sources (2024) – with major processing by Our World in Data. “CO₂ emissions per capita – GCB” [dataset]. Global Carbon Project, “Global Carbon Budget”; Various sources, “Population” [original data]. Retrieved April 5, 2025 from https://ourworldindata.org/grapher/co2-per-capita-marimekko