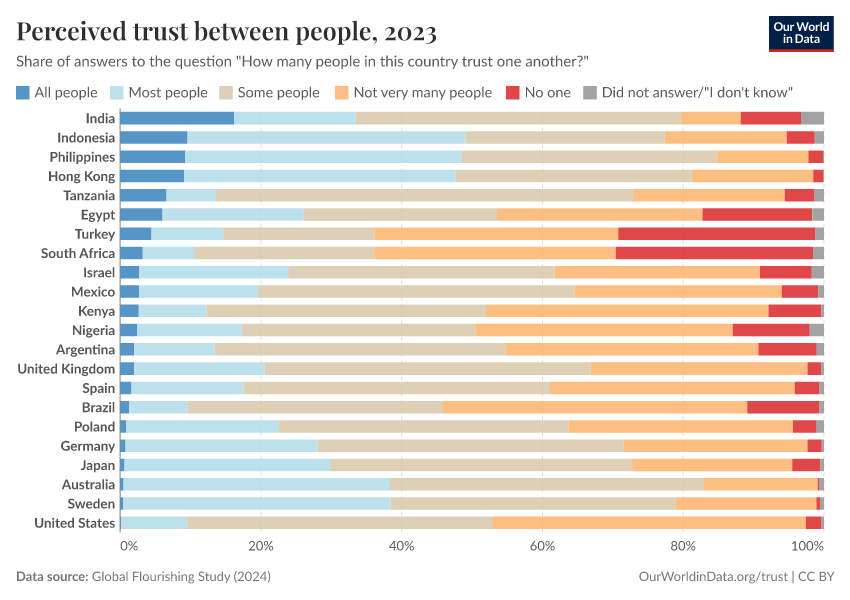
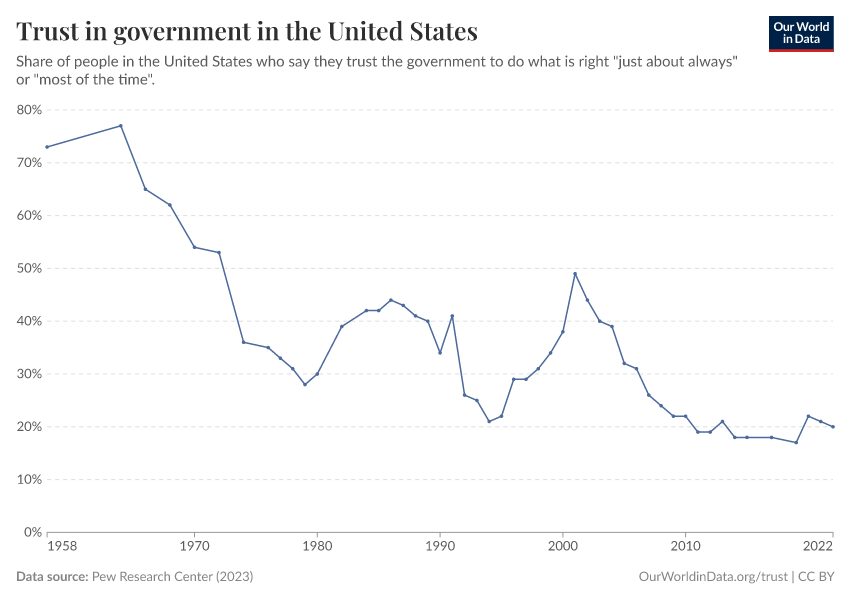
Trust
How does interpersonal trust differ across societies and what role does it play in shaping economic development?
This article was first published in July 2016 and last updated in April 2024.
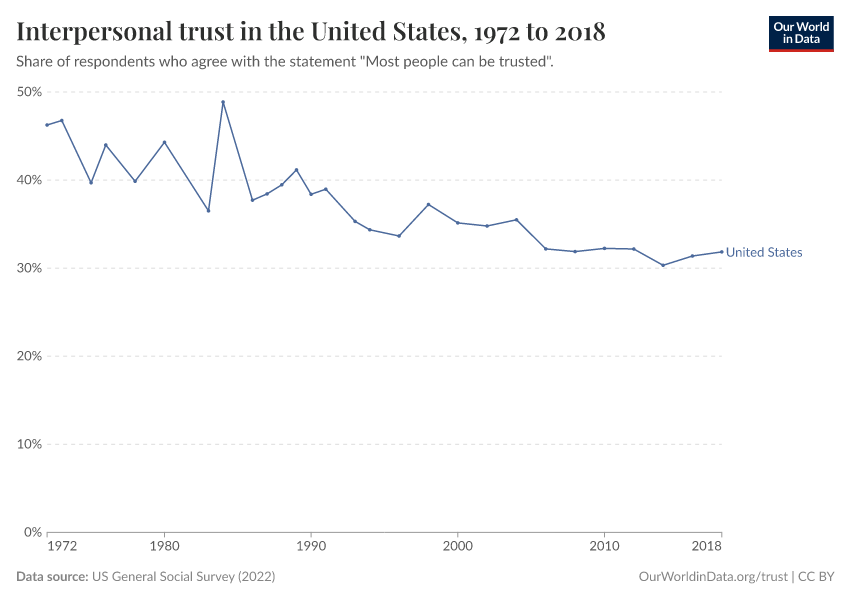
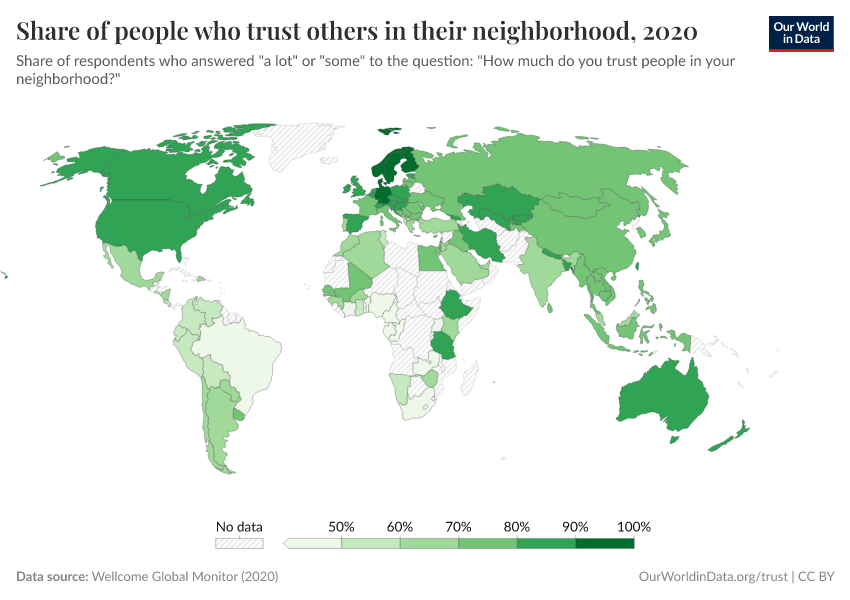
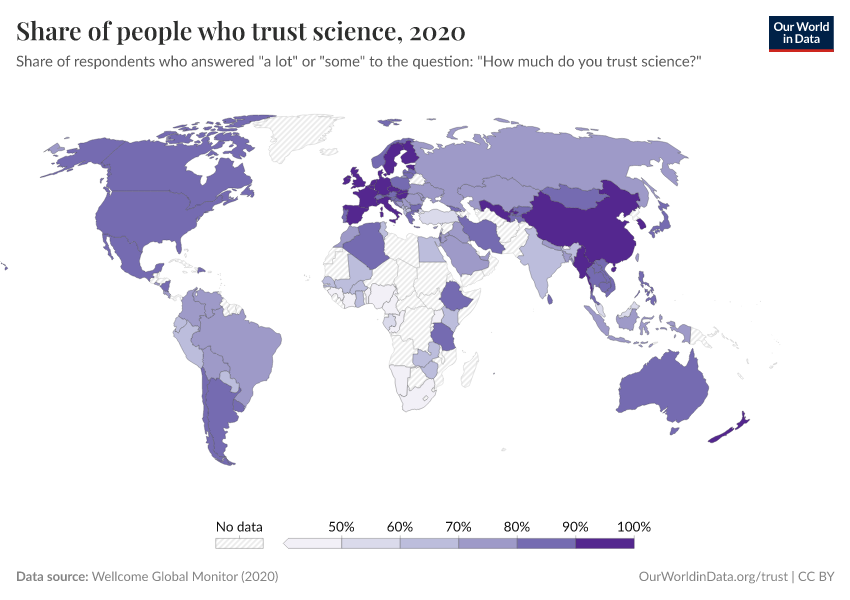
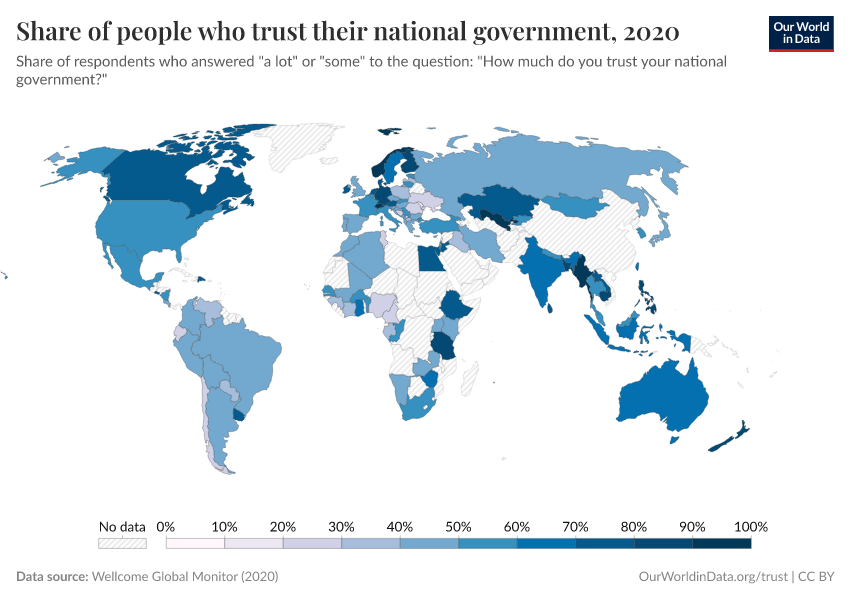
Trust is a fundamental element of social capital — essential for the cohesion of communities, vital for effective cooperation, and crucial for economic development.
On this page we present data on trust and examine the distribution and reliability of available measures. We also explore the research that studies the link between trust and economic development.
See all interactive charts on trust ↓
Interpersonal trust around the world
One of the most widely used tools to measure trust attitudes across the world comes from the World Values Survey – an international research project that has been conducting standardized nationally-representative social surveys enquiring about political, socioeconomic, and cultural values of people around the world for decades.
The World Values Survey (WVS) asks many different questions about trust. Their most general question asks: “Generally speaking, would you say that most people can be trusted or that you need to be very careful in dealing with people?" Possible answers include "Most people can be trusted", "Do not know", and "Need to be very careful".
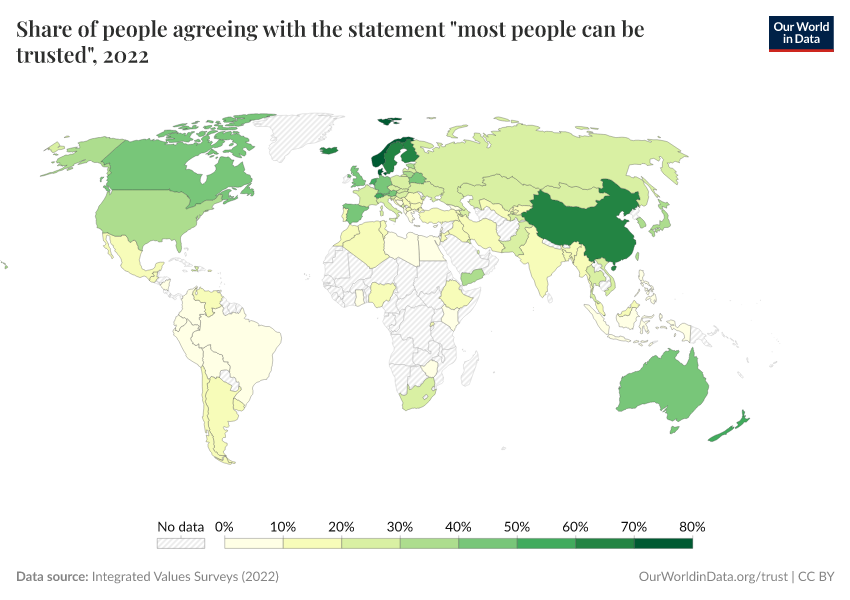
The map below shows the share of respondents who answered “most people can be trusted” to this question.
The differences between countries that we can see in this map are very large. In Norway and Sweden for example, more than 60% of the survey respondents think that most people can be trusted. At the other end of the spectrum, in Colombia, Brazil and Peru less than 10% think that this is the case.

The link between trust and economic outcomes
What is the relationship between trust and economic growth?
The question of trust and its importance for economic development has attracted the attention of economists for decades.
In his 1972 article “Gifts and Exchanges,” Kenneth Arrow, who was awarded the Nobel Prize in Economic Sciences in the same year, observed that “virtually every commercial transaction has within itself an element of trust, certainly any transaction conducted over a period of time.”1
Most of us have likely experienced this in our own lives — it’s challenging to engage in dealings where trust in the other party is lacking.
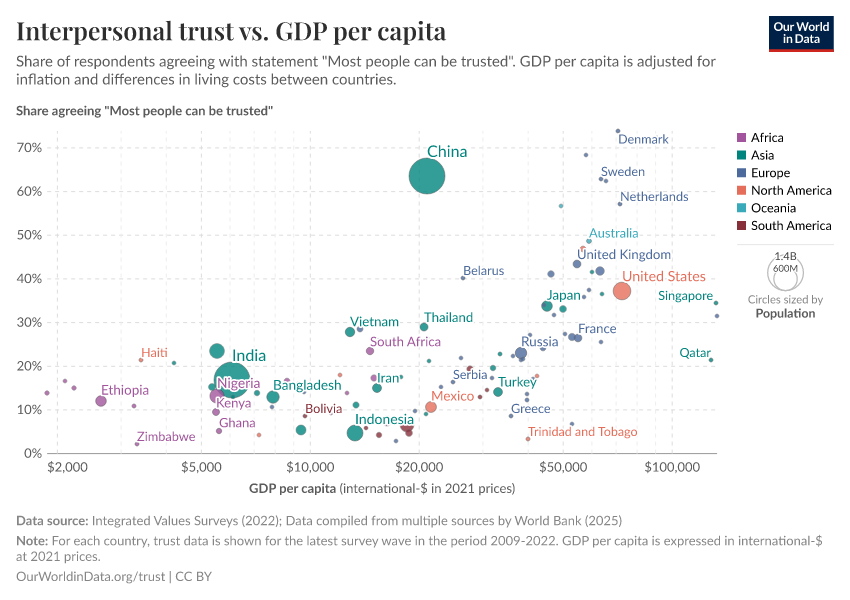
The following chart shows the relationship between GDP per capita and trust, as measured by the World Values Survey. There is a strong positive relationship: countries with higher self-reported trust attitudes are also countries with higher economic activity.
When digging deeper into this connection using more detailed data and economic analysis, researchers have found evidence of a causal relationship, suggesting that trust does indeed drive economic growth and not just correlate with it.2
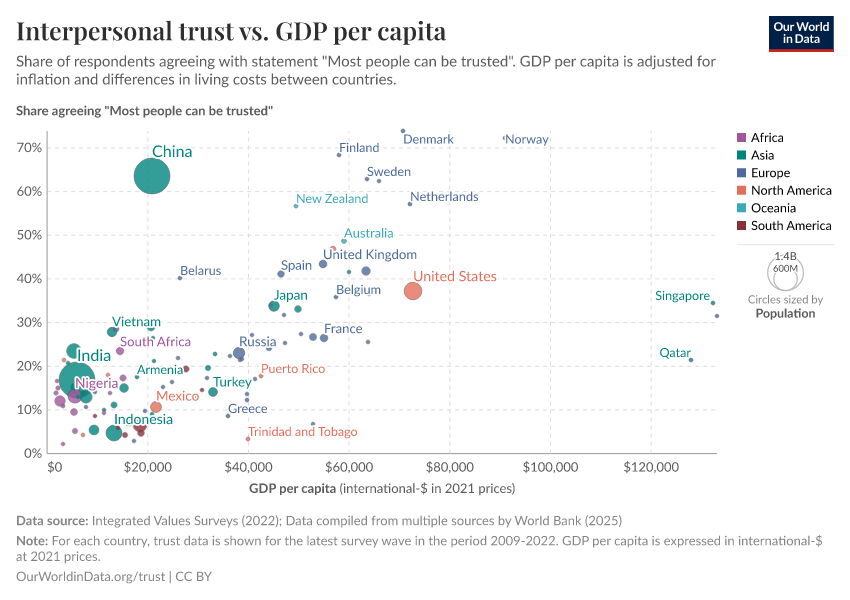
There are many mechanisms through which cultural factors, such as trust, can causally affect economic growth.3
Low trust levels can increase transaction costs, which can have significant economic efficiency costs. Additionally, low trust levels can discourage people from investing in public goods and infrastructure (e.g. by voting for different politicians, or evading taxes), as they do not trust that their money will be utilized effectively.4
What is the relationship between trust and income inequality?
Data comparing trust levels between countries, and even data on differences within countries, shows that more economic inequality tends to go together with lower levels of trust.5
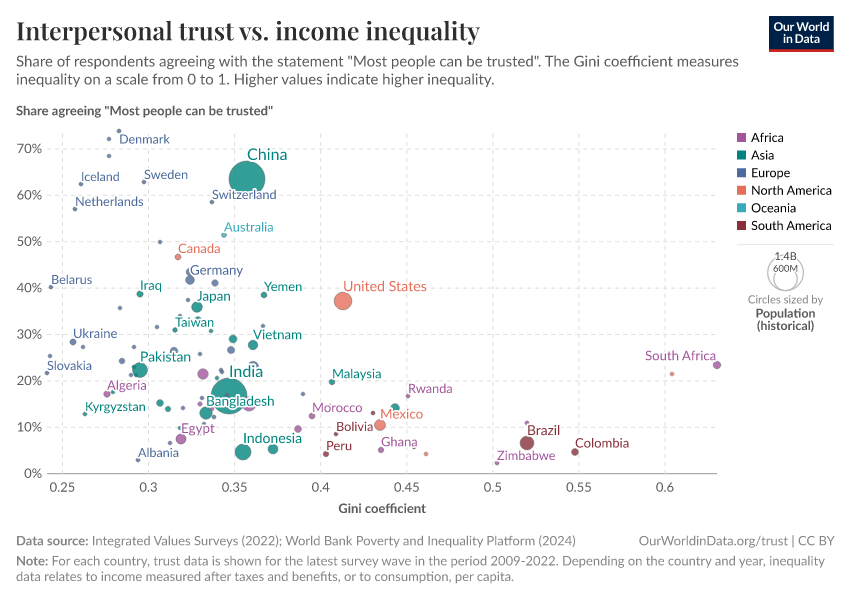
The next visualization supports this idea: it’s a scatter plot comparing trust estimates from the World Values Survey against income inequality measured by the Gini index.
Each dot on this scatter-plot corresponds to a different country, with colors representing different world regions and dot sizes representing the size of the population. A Gini index of 0 would represent perfect equality, so the observed negative correlation in this graph shows that higher inequality is associated with lower trust.
This link between more inequality and less trust can be explained by the fact that people are often more willing to trust those who are similar to themselves; or because higher inequality may lead to conflicts over resources.6
Measuring Trust
Do different surveys give a consistent picture of interpersonal trust?
Interpersonal trust is often measured through surveys, where people are asked to self-report trust attitudes.
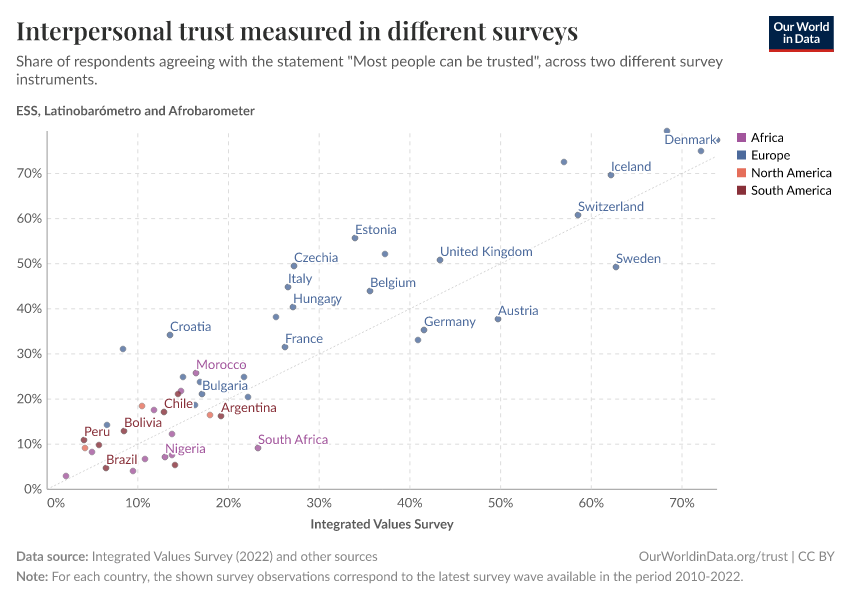
The following scatter plot compares cross-country estimates of trust, using data from two different surveys for each country. By comparing the estimates from different surveys, we can check if similar but different measurement methods provide a consistent and robust picture of interpersonal trust.
The chart shows that there is consistency — in countries where one survey reports high levels of self-reported trust, the other survey reflects the same. For example, in Peru, both the World Values Survey and the Latinobarometer report very low levels of self-reported trust.
The results across surveys are not identical, as we would expect. This is clear from the fact that countries are not all lined up along a perfect diagonal line. However, the strong positive correlation underscores the fact that measurement is relatively consistent across similar surveying methodologies.
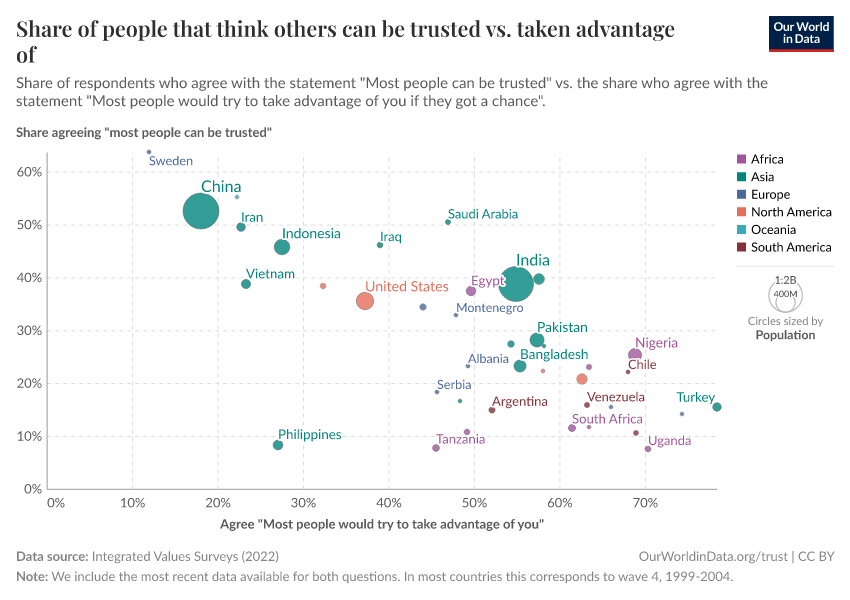
Another way to evaluate the robustness of the data is by comparing responses to similar yet different questions within the same survey. This can be checked using data from the World Values Survey, which includes multiple questions related to trust.
Our next chart illustrates this by comparing the percentage of respondents who agree with the statement "most people can be trusted" against those who agree that "most people would try to take advantage of you if they had a chance."
Consider Peru again as an example. You find it in the bottom right corner of the chart. A significant share of Peruvians report thinking that others they interact with would try to take advantage of them if given the chance. Correspondingly, only a small fraction of people in the country report believing that others can be trusted.
Do trust estimates from attitudinal survey questions predict trusting behaviour?
Trust is a complex concept shaped by many factors. One key factor is how trustworthy we perceive others to be. Not trusting can be a reaction to expecting others not to be trustworthy. In other words, lack of trust can be a rational response to an expectation of untrustworthiness.
Researchers who have studied this question empirically, have found that while expectations of trustworthiness do play a role in shaping trust behaviours, there is more to the story.7 In a study published in the journal Experimental Economics in 2006, Nava Ashraf and co-authors explored this by conducting experiments where participants played investment and dictator games, using actual monetary incentives.8
The games were designed to see how people decide to trust or share when real money is at stake. The experiment found that trust was not solely driven by expectations of receiving something in return, but also by acts of unconditional kindness, or matters of principle.
This perhaps resonates with our personal experience. Trust can be something intrinsically valuable. There are contexts where we trust simply because we think it’s the right thing to do.
Key Charts on Trust
See all charts on this topicEndnotes
Arrow, K. J. (1972). Gifts and exchanges. Philosophy & Public Affairs, 343-362
For an overview of the evidence see Algan, Y., & Cahuc, P. (2013). Trust and growth. Annu. Rev. Econ., 5(1), 521-549.
Guiso, L., Sapienza, P., & Zingales, L. (2006). Does culture affect economic outcomes? The journal of economic perspectives, 20(2), 23-48.
It's important to note that the relationship between growth and trust is bidirectional, with evidence suggesting that economic growth can also influence trust levels. You can read more about this in Algan, Y., & Cahuc, P. (2013). Trust and growth. Annu. Rev. Econ., 5(1), 521-549.
Jordahl, H. (2009). Inequality and trust. Published as" Economic Inequality" in Svendsen, GT and Svendsen, GLH (Eds.), Handbook of Social Capital, Edward Elgar.
Alesina, A., & La Ferrara, E. (2002). Who trusts others?. Journal of public economics, 85(2), 207-234.
Glaeser et al. (2000) examine the predictive power of two types of survey questions: questions about trusting attitudes and questions about past trusting behavior. The authors examine the predictive power of these questions by comparing survey answers with actual trusting behaviour in an incentivised experimental setting with monetary rewards. They show that, while measures of past trusting behavior are better than the abstract attitudinal questions in predicting subjects' experimental choices, in general terms they are both weak predictors of trust. Interestingly, however, questions about trusting attitudes do seem to predict trustworthiness. In other words, people who say they trust other people tend to be trustworthy themselves. You can read more directly from their paper: Glaeser, E. L., Laibson, D. I., Scheinkman, J. A., & Soutter, C. L. (2000). Measuring trust. Quarterly Journal of Economics, 811-846.
Ashraf, N., Bohnet, I., & Piankov, N. (2006). Decomposing trust and trustworthiness. Experimental economics, 9, 193-208.
Cite this work
Our articles and data visualizations rely on work from many different people and organizations. When citing this topic page, please also cite the underlying data sources. This topic page can be cited as:
Esteban Ortiz-Ospina, Max Roser, and Pablo Arriagada (2016) - “Trust” Published online at OurWorldinData.org. Retrieved from: 'https://ourworldindata.org/trust' [Online Resource]BibTeX citation
@article{owid-trust,
    author = {Esteban Ortiz-Ospina and Max Roser and Pablo Arriagada},
    title = {Trust},
    journal = {Our World in Data},
    year = {2016},
    note = {https://ourworldindata.org/trust}
}
Reuse this work freely
All visualizations, data, and code produced by Our World in Data are completely open access under the Creative Commons BY license. You have the permission to use, distribute, and reproduce these in any medium, provided the source and authors are credited.
The data produced by third parties and made available by Our World in Data is subject to the license terms from the original third-party authors. We will always indicate the original source of the data in our documentation, so you should always check the license of any such third-party data before use and redistribution.
All of our charts can be embedded in any site.
