


 Guam Country Profile
CO₂ and Greenhouse Gas Emissions
Many of us want an overview of where our country stands on CO₂ and other greenhouse gas emissions. Are they increasing or decreasing? How do levels compare to other countries? This page provides the data for your chosen country across key metrics on this topic.
The data will be updated annually with the latest global and country emissions estimates.
What share of Guam’s CO₂ emissions are produced from different fuels?
CO2 emissions are dominated by the burning of fossil fuels for energy production, and industrial production of materials such as cement.
What is the contribution of each fuel source to the country’s CO2 emissions?
This interactive chart shows the breakdown of annual CO2 emissions by source: either coal, oil, gas, cement production or gas flaring. This breakdown is strongly influenced by a country's energy mix and changes as it shifts to or away from a given energy source.

How are Guam’s CO₂ emissions from different fuels changing?
The chart above allows us to see the breakdown of CO2 emissions by fuel type. But it makes it more difficult to see the absolute change in particular fuel sources over time.
This interactive chart shows the same data — CO2 emissions from coal, oil, gas, cement and flaring — but as individual lines to see clearly how each is changing over time.

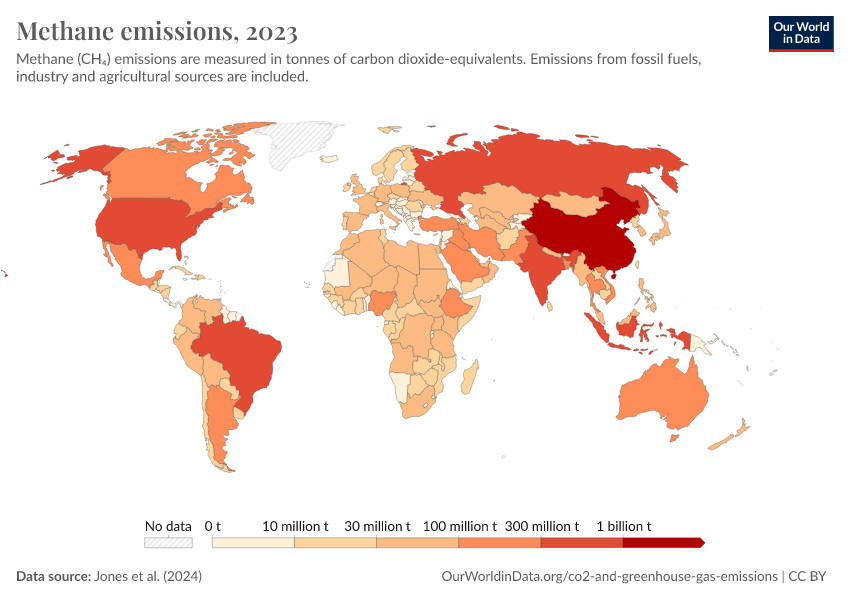
Methane: how much does the average person in Guam emit? Where do emissions come from?
Methane (CH4) is a strong greenhouse gas, mainly produced through agricultural activities (e.g. livestock and rice production), in addition to leakages from oil and gas production (called ‘fugitive emissions’).
This first interactive chart here shows per capita emissions of methane each year. This is measured in ‘carbon dioxide equivalents’.
The other interactive chart shows the sources of these emissions and the contribution of each sector.


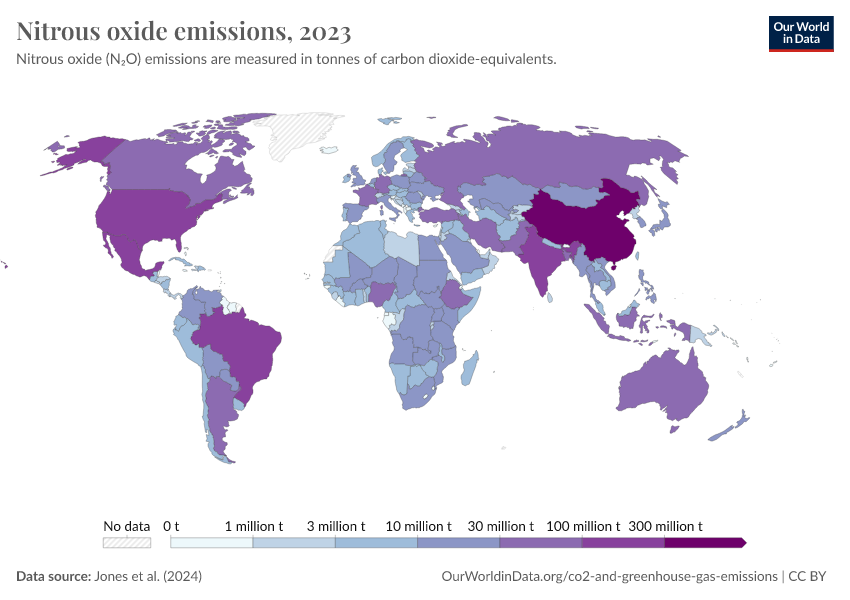
Nitrous oxide: how much does the average person in Guam emit? Where do emissions come from?
Nitrous oxide (N2O) is a strong greenhouse gas that is mainly produced from agricultural activities (e.g. from the use of synthetic and organic fertilizers to grow crops).
This first interactive chart here shows per capita emissions of nitrous oxide each year. This is measured in ‘carbon dioxide equivalents’.
The other interactive chart shows the sources of these emissions and the contribution of each sector.


Has Guam’s economic growth decoupled from its CO₂ emissions?
To reduce emissions and achieve increasing prosperity at the same time, we have to decouple economic growth from CO2 emissions. Several countries have achieved this in recent years.
The chart here shows whether this country has achieved this by showing the change in GDP per capita, and annual per capita CO2 emissions over time.
We show both territorial and consumption-based emissions (where available). This allows us to see whether the import of production from other countries — or the export to other countries — has affected this change in emissions.

Cite this work
Our articles and data visualizations rely on work from many different people and organizations. When citing this profile page, please also cite the underlying data sources. This profile page can be cited as:
Hannah Ritchie and Pablo Rosado (2025) - “CO₂ and Greenhouse Gas Emissions” Published online at OurWorldinData.org. Retrieved from: 'https://ourworldindata.org/profile/co2/guam' [Online Resource]BibTeX citation
@article{owid-co2-guam,
    author = {Hannah Ritchie and Pablo Rosado},
    title = {CO₂ and Greenhouse Gas Emissions},
    journal = {Our World in Data},
    year = {2025},
    note = {https://ourworldindata.org/profile/co2/guam}
}
Reuse this work freely
All visualizations, data, and articles produced by Our World in Data are completely open access under the Creative Commons BY license. You have the permission to use, distribute, and reproduce these in any medium, provided the source and authors are credited.
The data produced by third parties and made available by Our World in Data is subject to the license terms from the original third-party authors. We will always indicate the original source of the data in our documentation, so you should always check the license of any such third-party data before use and redistribution.
All of our charts can be embedded in any site.