The world has recently become less democratic
Many more people have democratic rights than in the past. Some of this progress has recently been reversed.
Many more people than in the past have democratic rights. But now there is growing concern that this progress is currently being partially undone.1 Is this true? Has the world become less democratic recently?
This article shows that the leading approaches to measuring democracy indicate that this is true: the world has become less democratic in recent years.
Democracy is in decline, whether we look at big changes in the number of democracies and the people living in them; at small changes in the extent of democratic rights; or at medium-sized changes in the number of, and people living in, countries that are autocratizing.2
The extent of this decline is substantial, but it is also uncertain and limited. We can see it clearly across democracy metrics: the world has fallen from all-time democratic highs to a level similar to earlier decades. But the extent of this decline depends on which democracy measure we use. And it is limited in the sense that the world remains much more democratic than it was even half a century ago.
Finally, the recent democratic decline is precedented, and past declines were reversed. The world underwent phases of autocratization in the 1930s and again in the 1960s and 1970s. Back then, people fought to turn the tide, and pushed democratic rights to unprecedented heights. We can do the same again.
Recently, the number of democracies has declined…
The simplest way to explore whether the world has recently become less democratic is by looking at how many countries are democracies.
In the chart I rely on the Regimes of the World (RoW) classification3 as a measure for whether a country is a democracy. You can read more about the data in our article on it.
Using the RoW data, the chart shows that the world has become less democratic in recent years. The number of democracies in the world reached an all-time high in 2016, with 95 electoral democracies. In 2025, their number has fallen to 87 countries.
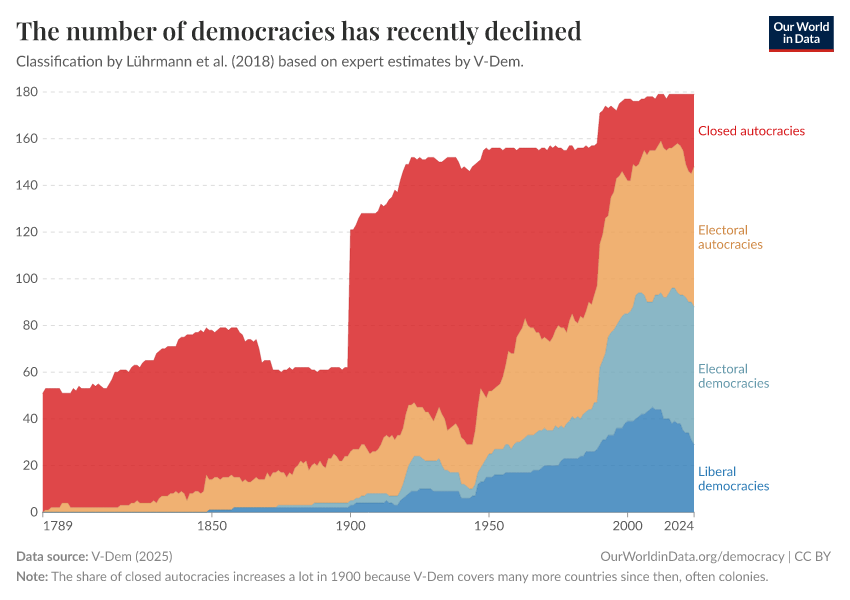
RoW is just one of the leading approaches of identifying which countries are democracies. But the findings are similar when we look at other approaches to measuring democracy: you can see this in versions of the same chart based on the Lexical Index, Boix-Miller-Rosato, Freedom House, and the Economist Intelligence Unit.4 You can find all these charts and more in our Democracy Data Explorer.
The same is true of liberal democracies. Their number has fallen from 45 countries in 2009 to 31 in 2025.
…and fewer people are living in democracies
The number of democracies does not tell us how many people enjoy democratic rights. But when we look at this data, the findings are the same.
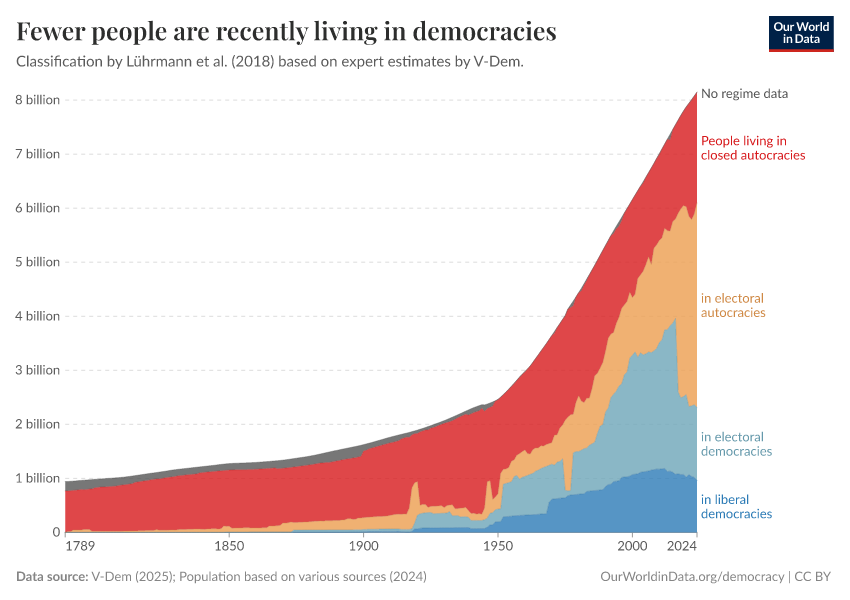
The number of people that have democratic rights has recently plummeted: between 2016 and 2025, this number fell from 3.9 billion to 2.2 billion people.
Similarly, the number of people living in liberal democracies fell from 1.2 billion in 2012 to 600 million most recently.
Examples of people losing democratic rights — according to the RoW data — are the 1.4 billion people in India,5 the 84 million people in Turkey, and the 28 million people in Venezuela.6
Instead of the absolute number of democracies and people living in them, we may be interested in the share of democratic countries and the share of the world population living in them. The world is also becoming less democratic based on these metrics.
In recent years, countries and people have fewer democratic rights
Looking at the number of democracies and the people living in them tells us about big changes worldwide: when countries become democracies, or stop being liberal or electoral democracies altogether.
But countries and their citizens may experience smaller changes in their democratic rights that fall short of changing the overall regime type. This is because the extent of democratic rights differs across democracies and non-democracies, but also within them. Such changes within regimes would not show up in the previous charts.
Therefore another way of looking at whether the world has recently become less democratic is to look at how democratic countries are, treating democracy as a spectrum.
We identify how democratic countries are with the electoral democracy index from the Varieties of Democracy (V-Dem) project.7 It captures the extent to which political leaders are elected under comprehensive voting rights in free and fair elections, and freedoms of association and expression are guaranteed. You can read more about the data in our article on it.
Using V-Dem’s electoral democracy index, the chart shows that countries, on average, have become less democratic: in 2025, countries received an electoral-democracy score of 0.48 on the scale from 0 to 1. This score is slightly lower than the highest-ever average of electoral democracy (0.53) in 2012.
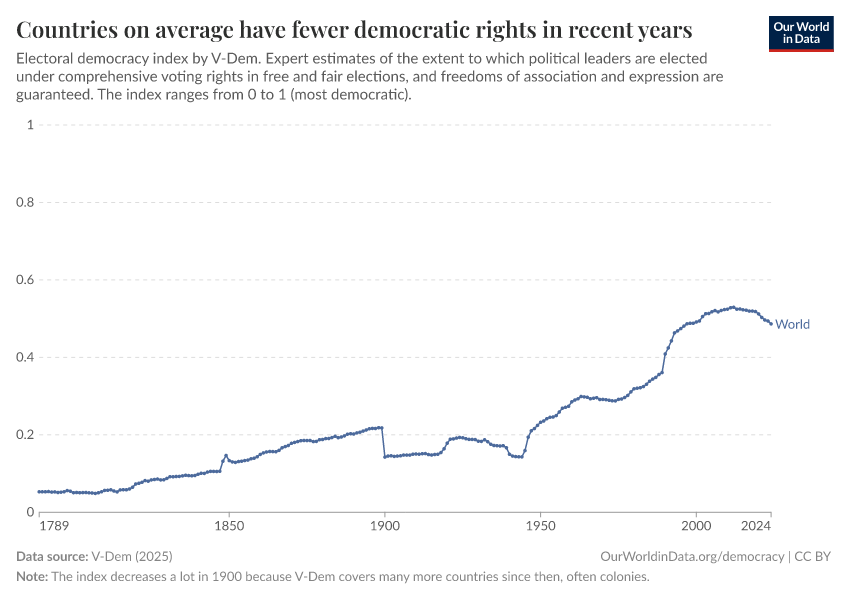
The chart shows one of several leading approaches. But recent changes look similar if we instead use V-Dem’s other democracy indices, such as its liberal democracy index, or the Economist Intelligence Unit’s data.8
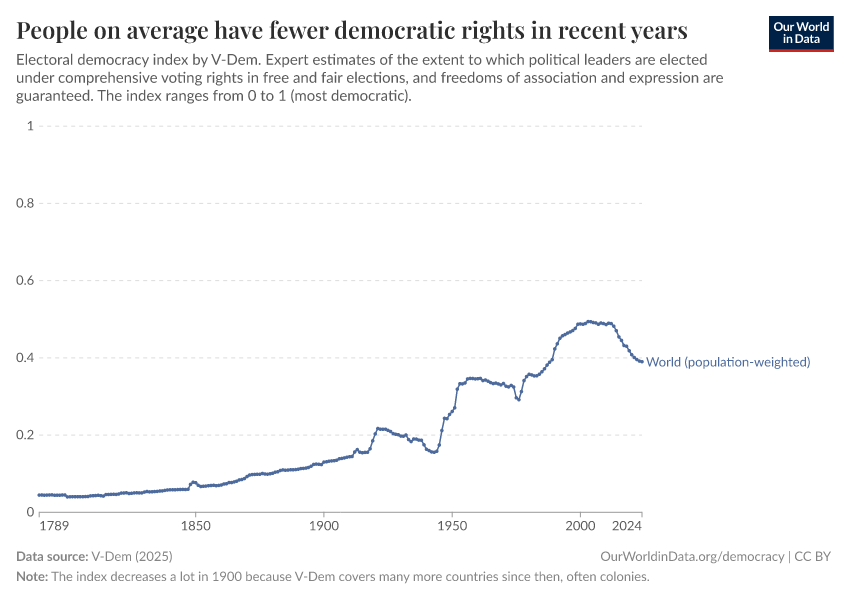
The next chart instead tells us about how many democratic rights people have by weighing a country’s democracy score by its population.9 Calculated this way, peoples’ democratic rights have decreased as well: countries received a population-weighted average score of 0.38 for electoral democracy in 2025. This is down from an all-time high of 0.49 in 2012.
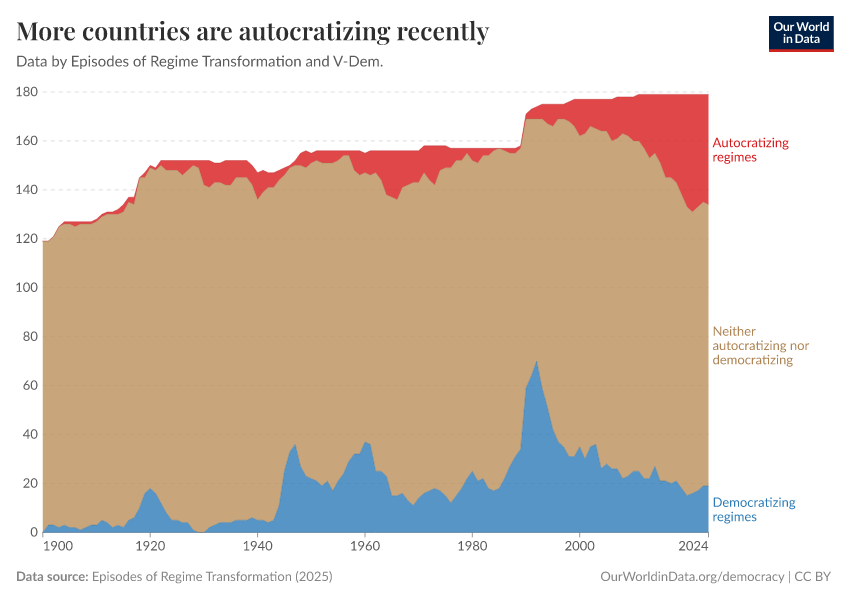
Recently, more countries are autocratizing, and more people live in them
Global averages in the extent to which countries are democratic and people enjoy democratic rights tell us about smaller changes in democracy that fall short of regime change.
But they do not tell us which countries are becoming more or less democratic.
One more way of studying global changes in democracy is therefore identifying how the number of countries that are autocratizing or democratizing is changing.
We identify which countries are becoming less or more democratic with data from the Episodes of Regime Transformation (ERT)-project.10 We use their data to identify which countries are autocratizing, democratizing, and which countries are not clearly moving in either direction.11 This chart shows how each country has been classified at the end of each year since 1900.
What does it mean for a country to be autocratizing or democratizing? ERT seeks to strike a balance between large and small changes in how democratic countries are.12 It captures smaller changes in democracy that fall short of regime change. At the same time, it only codes a country as autocratizing when there is a substantial decrease in its democracy score. This is because very small decreases may be fleeting and not indicate broader shifts towards less democracy, or overstate changes altogether because the measurement is uncertain.13 ERT also allows for temporary stagnation because autocratization may not happen abruptly in one year, but slowly over several years.14
As shown in the chart, the number of countries that are autocratizing has been increasing: in 2025, 45 countries were autocratizing. This is close to an all-time high. For a long time, the number of autocratizing countries was offset by a larger number of democratizing countries. But since 2012, the number of countries that are becoming less democratic has been higher.
The number of people living in autocratizing countries is increasing as well: in 2025, 3.3 billion people lived in countries that were becoming less democratic. This is an all-time high. The number has been trending upward since the late 1980s, with a large jump in 2008 when India was classified as becoming less democratic.15
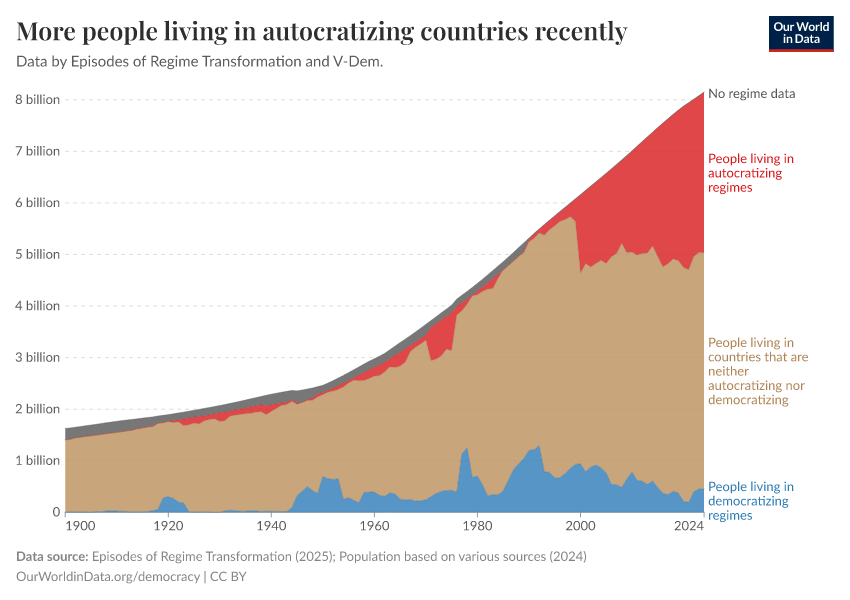
Other examples of people living in autocratizing countries according to the ERT data are the 274 million people in Indonesia, the 24 million people in Mali, and the 127 million people in Mexico.6
The countries becoming less democratic are both eroding democracies and hardening autocracies.
The democratic decline has been substantial, but more uncertain and limited
The data shown here indicate that the world has recently become less democratic. But how much less democratic has the world become?
Based on the data here, the democratic decline has been substantial. We can readily identify it in the different charts above. We can do so even though the charts put the recent trends into the historical context of the last two centuries. The world has fallen from all-time democratic highs to now — depending on the specific metrics — look more like the 2000s, the 1990s, or even the late 1980s.
But the extent of the democratic decline is also more uncertain; its precise degree depends on the approach of measuring democracy.
The clearest example of this is India. Since India is home to 1.4 billion people, its classification has a big impact on some global trends. RoW and ERT classify India as an electoral autocracy and as substantially autocratizing in recent years. The Lexical Index data, however, disagrees, and continues to classify the country as a democracy. This means that using that data, the number of people in the world living in democracies has declined less.
At the same time, we should not overstate the differences between the approaches either. All other approaches16 still identify a democratic decline in India. The approaches also tend to agree that metrics which look at people instead of countries see larger declines — because countries with large populations have tended to lose more democratic rights. The choice of approach therefore does not matter so much that it would question all characteristics of the recent global democratic decline.17
And while the democratic decline has been substantial, it so far has been limited. The world is still much closer to all-time democratic highs than to historical levels: this clearly is the case for the 19th and early 20th centuries, when democratic rights and democracies were nearly absent. But it also holds for large parts of the later 20th century, when democratic rights were heavily concentrated in some parts of the world.
The world has become less democratic before — and turned the tide
A decline in democratic rights might seem like an unprecedented step backwards. But it is not. It has happened before: the world underwent prolonged phases of autocratization in the 1930s and again in the 1960s and 1970s.

In the 1930s, a similar number of democracies as recently broke down — though back then that meant more than half of the world’s previously democratic countries. And the decline in the global democratic average was much larger than it has been recently.
In the 1960s and 1970s, many countries were becoming less democratic, with as many as 20 countries autocratizing at any given time. And several hundred million people lost democratic rights when India’s democracy eroded.
But these declines in democracy were temporary. People in India and around the world gained more democratic rights than ever before.
People turned previous autocratic tides by advocating relentlessly for governing themselves democratically. We have done it before, and can do it again.
Keep reading on Our World in Data
Acknowledgements
I thank Hannah Ritchie and Max Roser for their very helpful comments and ideas about how to improve this article.
Endnotes
See for example:
Lührmann, Anna, and Staffan Lindberg. 2019. A third wave of autocratization is here: what is new about it? Democratization 26(7): 1095-1113.
Haggard, Stephan, and Robert Kaufman. 2021. The Anatomy of Democratic Backsliding. Journal of Democracy 32(4): 27-41.
I use ‘autocratizing’ and ‘becoming less democratic’ as synonyms.
Lührmann, Anna, Marcus Tannnberg, and Staffan Lindberg. 2018. Regimes of the World (RoW): Opening New Avenues for the Comparative Study of Political Regimes. Politics and Governance 6(1): 60-77
I do not include the regime classifications by Polity and the Bertelsmann Transformation Index here because Polity currently ends in 2018, and the Bertelsmann Transformation Index does not cover countries they consider to be consolidated democracies.
The reclassification in RoW is the result of recent changes in the V-Dem data, which identify declines in the autonomy of the election management body, the freedom and fairness of elections, and especially the freedom of expression, the media, and civil society. You can read more in V-Dem’s 2021 annual report Autocratization Turns Viral.
Different approaches to measuring democracy also identify democratic declines in these countries.
Coppedge, Michael, John Gerring, Carl Henrik Knutsen, Staffan I. Lindberg, Jan Teorell, David Altman, Fabio Angiolillo, Michael Bernhard, Agnes Cornell, M. Steven Fish, Linnea Fox, Lisa Gastaldi, Haakon Gjerløw, Adam Glynn, Ana Good God, Sandra Grahn, Allen Hicken, Katrin Kinzelbach, Joshua Krusell, Kyle L. Marquardt, Kelly McMann, Valeriya Mechkova, Juraj Medzihorsky, Natalia Natsika, Anja Neundorf, Pamela Paxton, Daniel Pemstein, Johannes von Römer, Brigitte Seim, Rachel Sigman, Svend-Erik Skaaning, Jeffrey Staton, Aksel Sundström, Marcus Tannenberg, Eitan Tzelgov, Yi-ting Wang, Felix Wiebrecht, Tore Wig, Steven Wilson and Daniel Ziblatt. 2026. V-Dem [Country-Year/Country-Date] Dataset v16. Varieties of Democracy (V-Dem) Project.
I do not include the indices by Polity and the Bertelsmann Transformation Index here because Polity currently ends in 2018, and the Bertelsmann Transformation Index does not cover countries they consider to be consolidated democracies.
This means that populous countries matter more when calculating the average than countries with small populations.
Seraphine Maerz, Amanda Edgell, Joshua Krusell, Laura Maxwell, Sebastian Hellmeier. ERT - Episodes of Regime Transformation R package. Varieties of Democracy (V-Dem) Project. 2026.
Based on ERT, a country is autocratizing from when V-Dem’s electoral democracy index decreases by 0.01, until the score increases or remains unchanged for four years, and the total decrease between start and end amounts to a decrease of at least 0.10. Democratizing countries are classified analogously. We exclude the few country years for which democratization and autocratization episodes happen to overlap.
Maerz, Seraphine F., Amanda B. Edgell, Matthew C. Wilson, Sebastian Hellmeier, and Staffan I. Lindberg. (2024). Episodes of Regime Transformation. Journal of Peace Research, 61(6): 967{984.
This means, however, that some countries are not classified as autocratizing even though their score visibly declines. One example is the United States in the 2010s, whose decline between 2015 and 2020 fell just barely short of the ERT threshold.
Bermeo, Nancy. 2016. On democratic backsliding. Journal of Democracy 27(1): 5-19.
This move away from democratic rights looks very similar if instead of looking at absolute numbers, we look at the share of autocratizing countries or the world population living in them.
This includes the Lexical Index, Freedom House, the Bertelsmann TransformationIndex, and the Economist Intelligence Unit.
The same goes for uncertainty in the measurement of democracy itself.
Cite this work
Our articles and data visualizations rely on work from many different people and organizations. When citing this article, please also cite the underlying data sources. This article can be cited as:
Bastian Herre (2022) - “The world has recently become less democratic” Published online at OurWorldinData.org. Retrieved from: 'https://archive.ourworldindata.org/20260518-090244/less-democratic.html' [Online Resource] (archived on May 18, 2026).BibTeX citation
@article{owid-less-democratic,
    author = {Bastian Herre},
    title = {The world has recently become less democratic},
    journal = {Our World in Data},
    year = {2022},
    note = {https://archive.ourworldindata.org/20260518-090244/less-democratic.html}
}
Reuse this work freely
All visualizations, data, and articles produced by Our World in Data are completely open access under the Creative Commons BY license. You have the permission to use, distribute, and reproduce these in any medium, provided the source and authors are credited.
The data produced by third parties and made available by Our World in Data is subject to the license terms from the original third-party authors. We will always indicate the original source of the data in our documentation, so you should always check the license of any such third-party data before use and redistribution.
All of our charts can be embedded in any site.