Homelessness
How many people are affected by homelessness? How is their number changing over time? How does it look by gender?
Homelessness can take various forms: some people sleep in the streets, some in public spaces, and others are temporarily housed in emergency shelters.
This makes measuring the extent of homelessness difficult. First, countries define and measure homelessness differently, making numbers challenging to compare. Methods sometimes even differ for the same country over time or across regions.
Second, these statistics can miss people who are only briefly homeless, stay with friends, live in their car, or do not seek formal support.
However, while it is challenging to measure homelessness, it is essential to try. Housing is a basic human need and homelessness matters for many other problems that we focus on at Our World in Data. People who are homeless often face poverty, poorer physical and mental health, and shorter lifespans.
On this page, you can find data and visualizations on the number of people affected by homelessness across different countries and how these numbers have changed over time. When presenting this data, we’ve been careful to clarify where comparisons can and can’t be made directly due to differences in definitions and methods.
See all interactive charts on homelessness ↓
How common is homelessness across the world?
Counting how many people are affected by homelessness across different countries is challenging because countries differ in how they define and measure homelessness.
The Organisation for Economic Co-operation and Development (OECD) works to make the definitions and methods as similar as possible. The charts below show this harmonized data.
The first chart presents countries that count the people affected by homelessness by counting on a single night each year those living on the street or staying in shelters. To adjust for the fact that countries have different populations, this is expressed as a rate: the number affected by homelessness per 100,000 people.
We see that countries have very different rates of homelessness. For example, 300 out of every 100,000 are reported homeless in France, while it’s fewer than 20 in Finland.
In about half of the countries, more than 100 in every 100,000 people are homeless. That means more than one per thousand people.
There are also differences in types of homelessness. The United States, for example, has relatively high numbers of people living in the streets or public spaces but fewer in temporary accommodations or shelters.
Not all countries on the chart can be directly compared. For example, Japan and Greece only report data on one type of homelessness, so they don’t give a complete picture of the total population affected by homelessness.

Other countries measure homelessness over the entire year instead of just on one night. They include anyone who lived on the street or stayed in a shelter at any time during the year. This data is shown below.
Again, we see significant differences. In Austria, more than 200 out of every 100,000 people were affected by homelessness, while in Croatia, it was less than a tenth of that.
When we look only at those in temporary accommodation and shelters, the numbers vary too. In Latvia, several hundred out of every 100,000 people are in shelters, whereas in Turkey, it’s fewer than 10.

Importantly, we can’t directly compare the data from the two charts above. Counting over a year will naturally include more people than counting on a single night.
The data in both charts mainly covers OECD member countries. Comparing data from non-OECD countries is even more complex because their definitions are often unclear, and the data is often sparse.
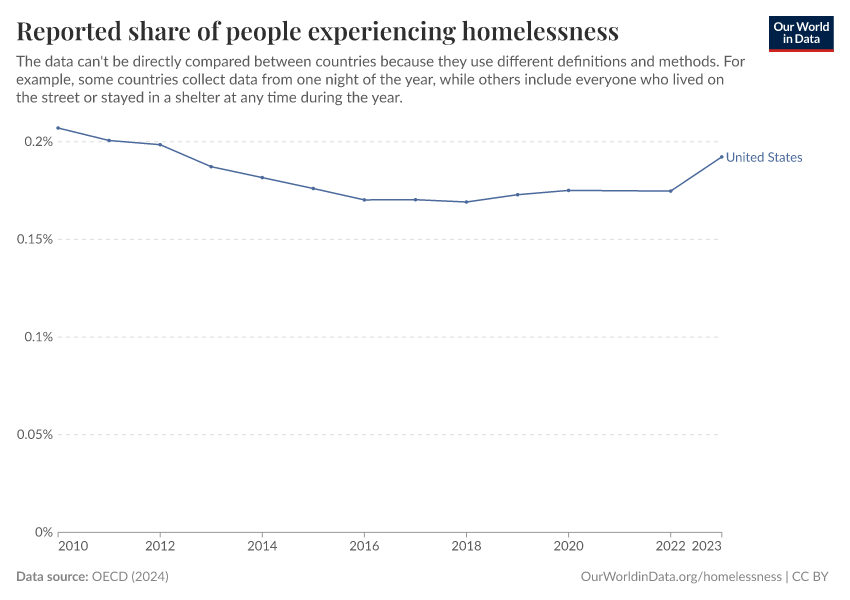
How is the share of people affected by homelessness changing?
The OECD provides data on the reported share of people experiencing homelessness over time for selected countries.
This data can’t be directly compared between countries because their definitions and methods differ significantly. Therefore, you can only choose one country at a time in the chart.
For example, the chart shows that the share of people affected by homelessness in the United States first slightly declined and then increased again over the last decade.
Other countries have seen different trends: during the same period, homelessness has doubled in England but halved in Finland.

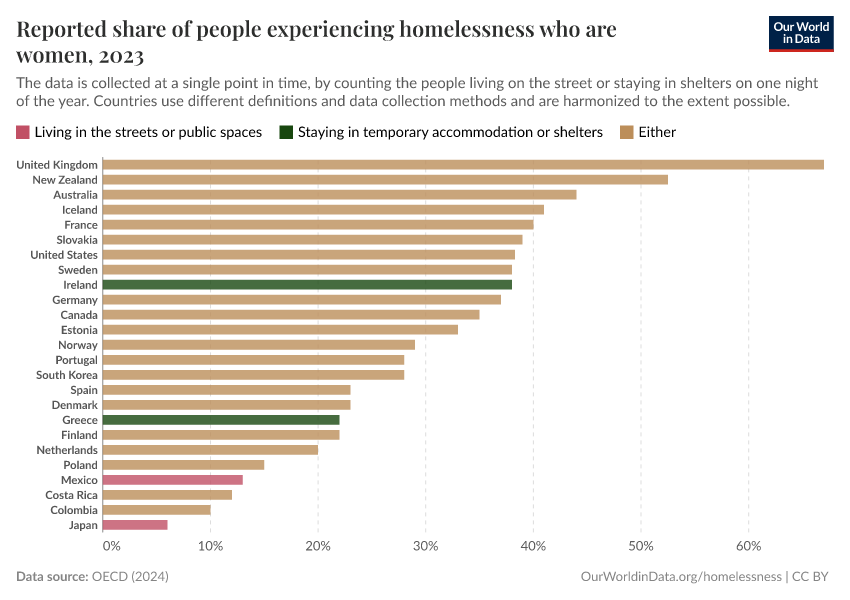
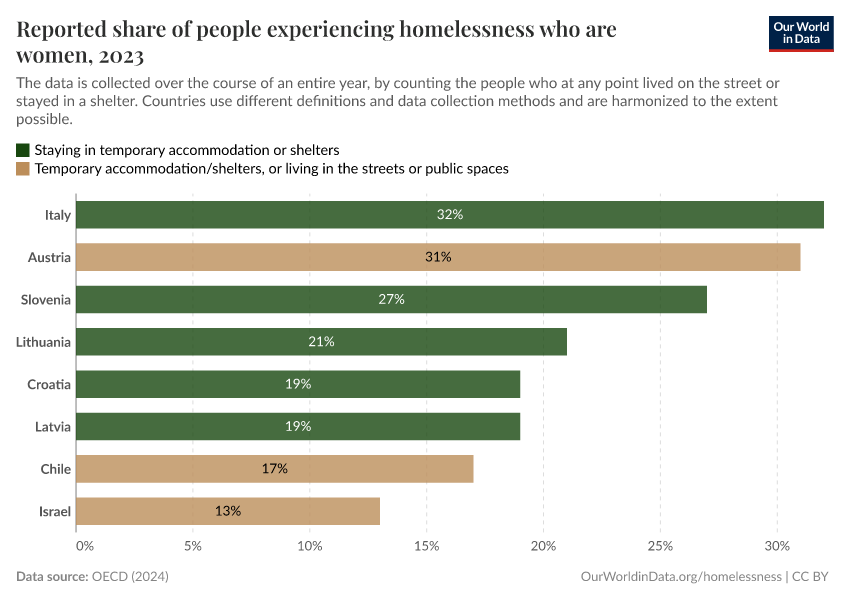
Men are more likely to be homeless in most countries, but there are exceptions
This chart shows the gender breakdown of people affected by homelessness.
In most countries, men tend to be more likely to experience homelessness than women. In many, women make up 20% to 40% of the homeless population.
But this ratio varies a lot by country. In Colombia and Costa Rica, men are much more likely to be affected by homelessness, with only around one in ten being women.
In the United Kingdom and New Zealand, it’s even the opposite: more women experience homelessness than men.

Different definitions of homelessness make international comparisons difficult
Homelessness is defined differently around the world, making it difficult to compare the issue across countries.
The map shows the forms of homelessness included in country statistics, as recorded by the Institute of Global Homelessness.
Sources distinguish three broad forms of homelessness: people with no accommodation who sleep in the streets or public spaces; people in temporary accommodation, such as emergency shelters; and people in severely inadequate housing, such as tents or slums.
The available statistics vary in which forms they include, with some focusing on just one type, while others cover multiple combinations. Many sources do not provide enough details to know which forms of homelessness they refer to.
Countries also differ in their data collection methods. For example, some countries count the number of people experiencing homelessness on one night of the year, while others do so over the entire year.
Despite these challenges, progress has recently been made. The Institute of Global Homelessness has collected data on the completeness of country statistics, and the OECD has worked on making the statistics of their members comparable by using the same definitions of homelessness across them.

Key Charts on Homelessness
See all charts on this topic


Related topics on Our World in Data
Acknowledgements
We thank Ali Bargu, Esteban Ortiz-Ospina, Edouard Mathieu, Hannah Ritchie, Max Roser, and Julia Wagner for their very helpful suggestions and ideas.
Cite this work
Our articles and data visualizations rely on work from many different people and organizations. When citing this topic page, please also cite the underlying data sources. This topic page can be cited as:
Bastian Herre and Pablo Arriagada (2024) - “Homelessness” Published online at OurWorldinData.org. Retrieved from: 'https://ourworldindata.org/homelessness' [Online Resource]BibTeX citation
@article{owid-homelessness,
    author = {Bastian Herre and Pablo Arriagada},
    title = {Homelessness},
    journal = {Our World in Data},
    year = {2024},
    note = {https://ourworldindata.org/homelessness}
}
Reuse this work freely
All visualizations, data, and code produced by Our World in Data are completely open access under the Creative Commons BY license. You have the permission to use, distribute, and reproduce these in any medium, provided the source and authors are credited.
The data produced by third parties and made available by Our World in Data is subject to the license terms from the original third-party authors. We will always indicate the original source of the data in our documentation, so you should always check the license of any such third-party data before use and redistribution.
All of our charts can be embedded in any site.