Global Education
A good education offers individuals the opportunity to lead richer, more interesting lives. At a societal level, it creates opportunities for humanity to solve its pressing problems.
The world has gone through a dramatic transition over the last few centuries, from one where very few had any basic education to one where most people do. This is not only reflected in the inputs to education — enrollment and attendance — but also in outcomes, where literacy rates have greatly improved.
Getting children into school is also not enough: what they learn matters. There are large differences in educational outcomes: in low-income countries, most children cannot read by the end of primary school. These inequalities in education exacerbate poverty and existing inequalities in global incomes.
On this page, you can find all of our writing and data on global education.
The world has made substantial progress in increasing basic levels of education
Access to education is now seen as a fundamental right. In many cases, it’s the government’s duty to provide it.
But formal education is a very recent phenomenon. In the chart, we see the share of the adult population — those older than 15 — who has received some basic education and those who haven’t.
In the early 1800s, fewer than 1 in 5 adults had some basic education. Education was a luxury; in all places, it was only available to a small elite.
But you can see that this share has grown dramatically, such that this ratio is now reversed. Less than 1 in 5 adults has not received any formal education.
This is reflected in literacy data, too: two centuries ago, very few could read and write. Now, most adults have basic literacy skills.

Despite being in school, many children don’t learn basic literacy skills
International statistics often focus on enrollment and attendance as the markers of educational progress. The aim is to get children into school.
However, being in school does not guarantee that a child receives a high-quality education. In fact, in many countries, the data shows that children learn very little.
In the chart, you can see the share of students who could read with comprehension at the end of primary education. This means they achieved minimum proficiency and could identify key ideas in texts and connect them to their own experiences. Here is the same visualization for skills in mathematics.
In many lower-income countries, fewer than 20% of children achieve this by the end of primary school.
Making sure that every child gets to go to school is essential. But the world also needs to focus on what children learn once they’re in the classroom.

Children across the world receive very different amounts of quality learning
There are still significant inequalities in the amount of education received by children across the world.
This can be measured as the total number of years that children spend in school. However, researchers can also adjust for the quality of education to estimate how many years of quality learning they receive. This is done using an indicator called “learning-adjusted years of schooling”.
On the map, you see vast differences across the world.
In many of the world’s poorest countries, children receive less than three years of learning-adjusted schooling. In most rich countries, this is more than 10 years.
Across most countries in South Asia and Sub-Saharan Africa, where most of the world’s children live, they get less than 7 years of quality schooling on average.
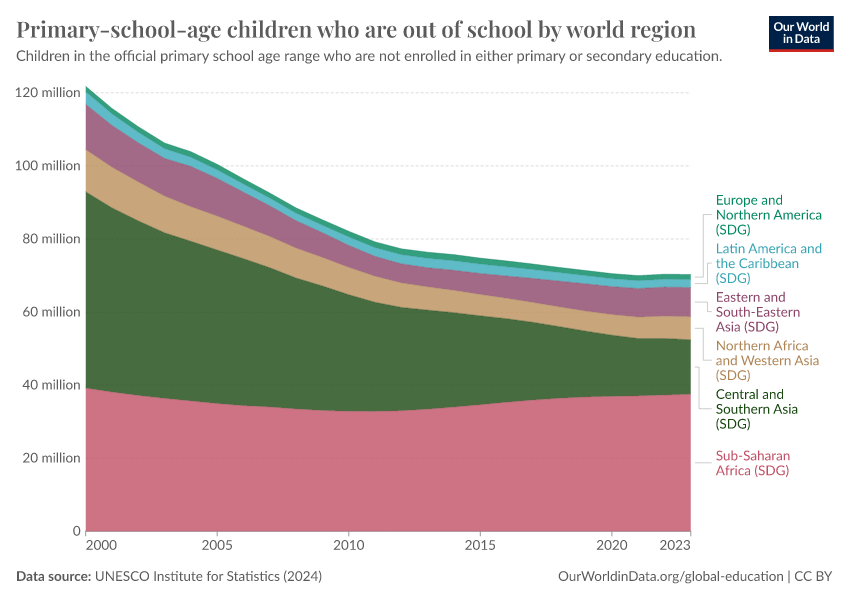
Hundreds of millions of children worldwide do not go to school
While most children worldwide get the opportunity to go to school, hundreds of millions still don’t.
In the chart, we see the number of children who aren’t in school across primary and secondary education.
This number was around 244 million in 2023.
Many children who attend primary school drop out and do not attend secondary school. That means many more children or adolescents are missing from secondary school than from primary education.
The gender gap in school attendance has closed across most of the world
At the global level, until recently, boys were far more likely to attend school than girls. The world has focused on closing this gap to ensure every child gets this opportunity.
Today, these gender gaps have largely disappeared. In the chart, we see the difference in the global enrollment rates for primary, secondary, and tertiary (post-secondary) education.
We see these lines converging over time, and recently they either completely met or become very narrow: rates between boys and girls are very similar.
In tertiary education, young women are now more likely than young men to be enrolled.
While the differences are small globally, there are some countries where the differences are still large: girls in Afghanistan, for example, are much less likely to go to school.

Research & Writing
Explore the data
The share of children and adolescents in school
One of the first and most basic indicators that captures a child’s opportunity to get formal education is the enrollment rate. This tells us what percentage of children of a given age group are enrolled in school.
This doesn’t tell us how often they attend or the quality of their learning, but it gives us a basic insight into the number of children in school.
UNESCO maintains a database of estimated enrollment rates at all levels of education, from pre-primary to tertiary.
In this chart, you can explore the data for these different education levels, and for boys and girls separately.
From this data, we see:
- Globally, most children are enrolled in primary school, but this tends to drop off through secondary education.
- In many lower-income countries, especially across Sub-Saharan Africa, the majority of adolescents are not enrolled in upper secondary education.
- Globally, girls are now almost just as likely to go to school as boys (both for primary and secondary education), but in some specific countries, girls are still at a large disadvantage.
You will notice that two indicators capture enrollment: “gross” and “net” rates.
Gross rates take all children enrolled in a given level of education and divide this by the population of children within the appropriate age group for that level (for example, aged 5 to 10 for primary education). This means they can include children who are older or younger than the “official age”, such as those who started school late or repeated a year. For this reason, rates can be over 100%.
Net rates only include children enrolled in school at the “official age”. So, an older child resitting a given year would not be included in the total.
Years of schooling
While most children in the world now get enrolled in primary school, the time that they will spend in formal education varies a lot.
A child who completes primary school, but then only goes to secondary school for a year or two (if at all), will get far fewer years of education than one who completes primary, secondary, and then goes on to tertiary education. This “school life expectancy” tells us something about how much they can learn.
In the chart, you can explore several indicators that try to capture years of schooling at different education levels, and for each gender. You'll find the average years of schooling completed by today’s adults, the number of years that children starting school are expected to spend in education, and the learning-adjusted years that show what this time really means once we account for how much students actually learn.
From this data, we see that:
- The expected years of schooling for a child in a lower-income country — especially across Sub-Saharan Africa — can be less than 10 years, compared to 16 to 20 years in high-income countries.
- These gaps are even wider for adults within the population. The average number of years of schooling for adults in some poorer countries is as few as 2 to 3 years. That’s a whole decade less than the average across Europe or North America.
- Again, the differences are stark when we try to adjust for the quality of teaching. A child in Nigeria, Ethiopia, or Chad is expected to receive the equivalent of fewer than 5 years of quality learning. It’s less than half the amount for a child in the United Kingdom, Sweden, or the United States.
- In low-income countries, boys are expected to receive more years of schooling than girls. In lower-middle-income countries, this gap is closed. And at higher incomes, the trend is reversed because young women are more likely to go to university than young men.
Literacy rates
Tracking inputs to education in the form of enrollment rates and time spent in school is important, but we also need to track basic outcomes of education.
Being able to read and write is a crucial skill for young people and adults, both for navigating daily life as well as being able to perform well in many jobs.
In the chart, you can explore literacy rates for young people, older people, and the adult population as a whole. This is also available by gender.
It’s important to note that this indicator only captures very basic literacy skills: being able to read and write a short, simple sentence with understanding. It has the drawback that it doesn’t test someone’s ability to engage with more complex language skills, nor does it test clear comprehension. These tests are much more resource-intensive and expensive to run, especially in lower-income countries.
You’ll notice that the map is very empty for most high-income countries. That’s because they reached near-universal levels by the late 20th century. Regular tracking has been scaled back, since changes are small and less relevant for education policy.
From this data, we see that:
- In a number of the world’s poorest countries — particularly across Sub-Saharan Africa — less than half of adults have this basic level of literacy.
- Younger people are much more likely to be able to read and write than older generations. In the world’s poorest countries, typically more than half of young people can read and write, compared to less than 20% in older generations.
- In many low- to middle-income countries, men are more likely to be literate than women. This is especially true among older adults.
- This gender gap has closed among young people in many countries, such as India, China, Ghana, and Rwanda. This is probably a result of the closing of the gender gap in school enrollment.
Featured Data on Global Education
Data Insights on Global Education
Cite this work
Our articles and data visualizations rely on work from many different people and organizations. When citing this topic page, please also cite the underlying data sources. This topic page can be cited as:
Hannah Ritchie, Veronika Samborska, Esteban Ortiz-Ospina, and Max Roser (2023) - “Global Education” Published online at OurWorldinData.org. Retrieved from: 'https://ourworldindata.org/global-education' [Online Resource]BibTeX citation
@article{owid-global-education,
    author = {Hannah Ritchie and Veronika Samborska and Esteban Ortiz-Ospina and Max Roser},
    title = {Global Education},
    journal = {Our World in Data},
    year = {2023},
    note = {https://ourworldindata.org/global-education}
}
Reuse this work freely
All visualizations, data, and code produced by Our World in Data are completely open access under the Creative Commons BY license. You have the permission to use, distribute, and reproduce these in any medium, provided the source and authors are credited.
The data produced by third parties and made available by Our World in Data is subject to the license terms from the original third-party authors. We will always indicate the original source of the data in our documentation, so you should always check the license of any such third-party data before use and redistribution.
All of our charts can be embedded in any site.