


What you should know about this indicator
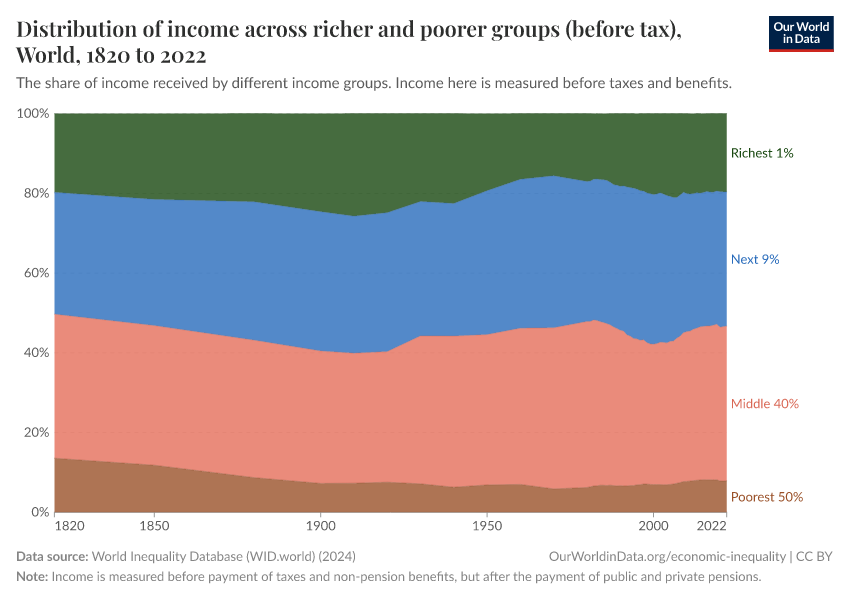
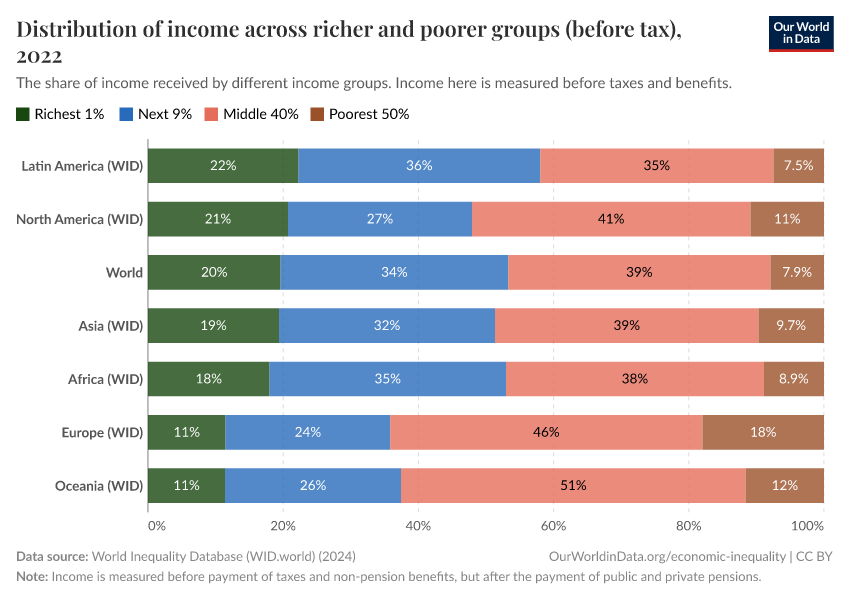
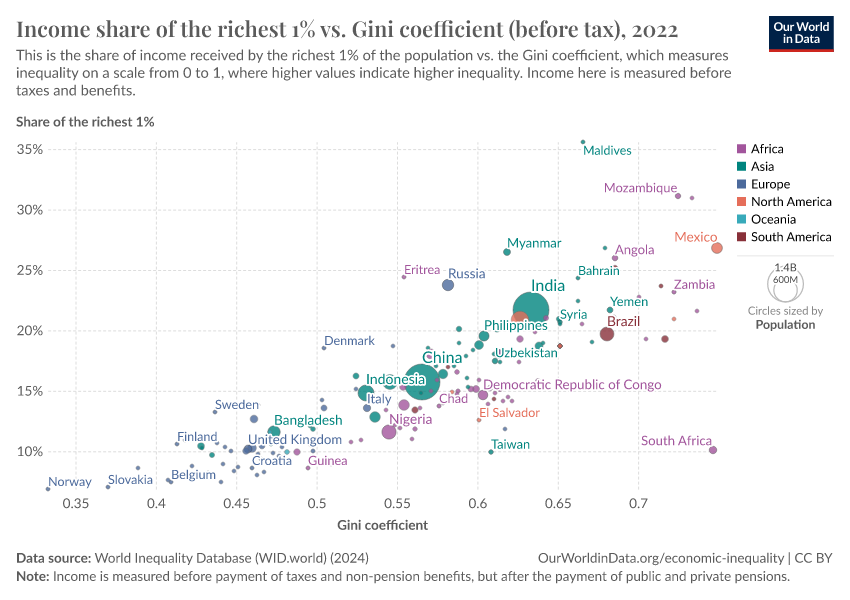
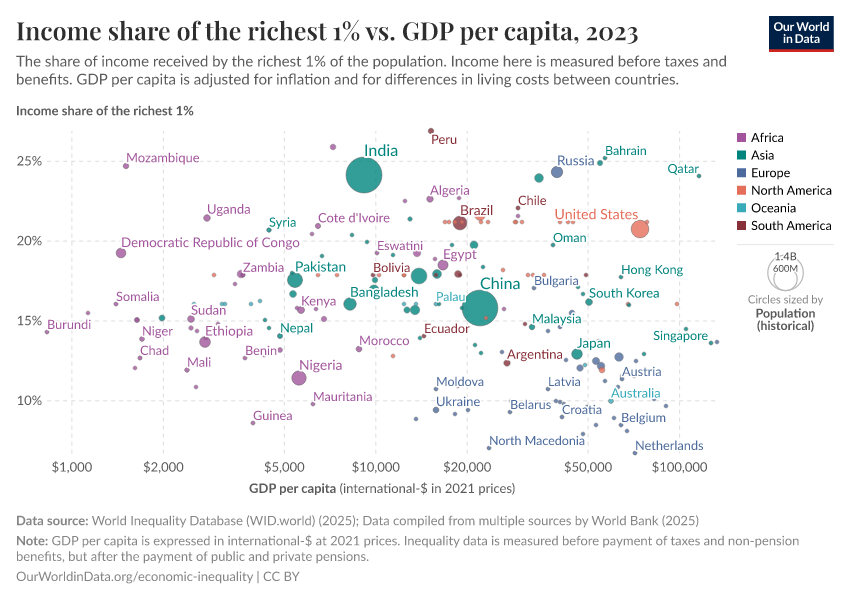
- The data shows the share of total income received by different income groups. These income shares are measures of inequality: if incomes were equally distributed, each 1% of the population would receive 1% of total income. Inequality in the distribution of income is present when richer groups receive a more-than-equal share, and poorer groups receive less. We discuss these measures and the data in more detail on our page on economic inequality.
- This data comes from the World Inequality Database (WID). This source has developed an approach to measuring inequality that aims to more accurately capture what is happening at the very top of the distribution, among the richest individuals. Traditional approaches, based on household survey data, tend to underestimate the incomes of the richest. WID tries to address this by combining data from tax records, surveys, and national accounts. You can read more about their method on our page.
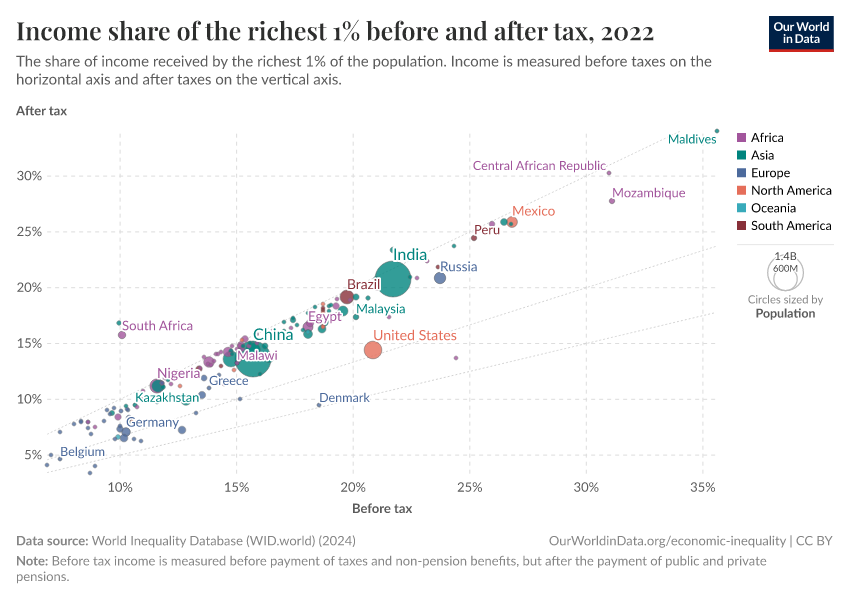
- Before tax income is measured before taxes have been paid and most government benefits have been received. The exception is pensions and other social insurance benefits, such as unemployment insurance — contributions to these are deducted, and the corresponding benefits are added back as income. Read more.
- Income here refers to national income — a broad measure of income across the whole economy taken from the national accounts. This includes components of income not usually attributed to individuals, or that people wouldn't normally think of as part of their own income, such as retained corporate profits and imputed rent from owner-occupied housing.
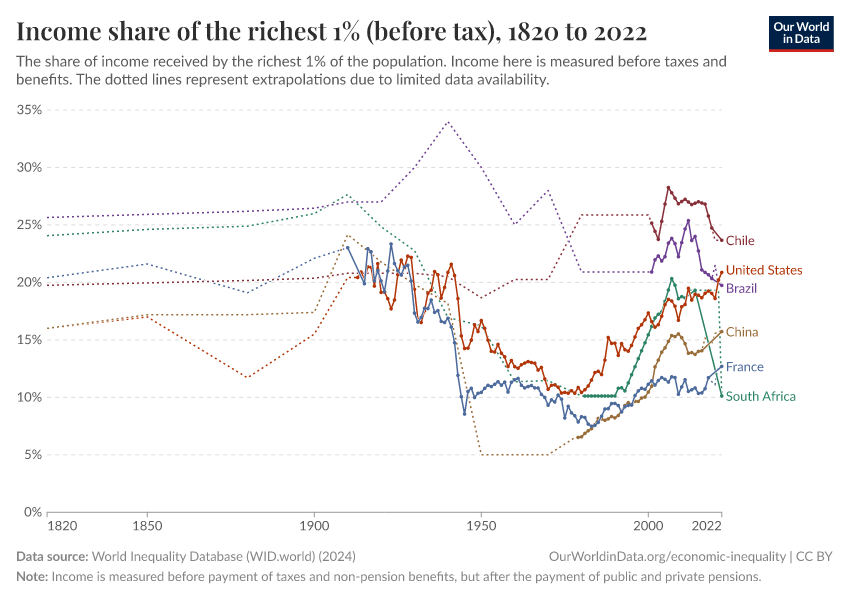
- For some countries and years, the underlying data sources (household surveys, tax records) are not available. In these cases, WID estimates the missing values by extrapolating from other years or data from other countries, which introduces uncertainty. For more information, see the WID methodology documentation.
Explore charts that include this data


More Data on Economic Inequality
Sources and processing
This data is based on the following sources
How we process data at Our World in Data
All data and visualizations on Our World in Data rely on data sourced from one or several original data providers. Preparing this original data involves several processing steps. Depending on the data, this can include standardizing country names and world region definitions, converting units, calculating derived indicators such as per capita measures, as well as adding or adapting metadata such as the name or the description given to an indicator.
At the link below you can find a detailed description of the structure of our data pipeline, including links to all the code used to prepare data across Our World in Data.
Notes on our processing step for this indicator
We extract estimations of Gini, mean, percentile thresholds, averages, and shares via the wid Stata command. We calculate threshold and share ratios by dividing different thresholds and shares, respectively.
Interpolations and extrapolations are excluded by using the option exclude in the Stata command.
Reuse this work
Citations
How to cite this page
To cite this page overall, including any descriptions, FAQs or explanations of the data authored by Our World in Data, please use the following citation:
“Data Page: Income share of the richest 1% (before tax)”, part of the following publication: Joe Hasell, Bertha Rohenkohl, Pablo Arriagada, Esteban Ortiz-Ospina, and Max Roser (2023) - “Economic Inequality”. Data adapted from World Inequality Database (WID.world). Retrieved from https://archive.ourworldindata.org/20260724-092634/grapher/income-share-top-1-before-tax-wid.html [online resource] (archived on July 24, 2026).How to cite this data
In-line citationIf you have limited space (e.g. in data visualizations), you can use this abbreviated in-line citation:
World Inequality Database (WID.world) (2026) – with major processing by Our World in DataFull citation
World Inequality Database (WID.world) (2026) – with major processing by Our World in Data. “Income share of the richest 1% (before tax) – WID” [dataset]. World Inequality Database (WID.world), “World Inequality Database (WID)” [original data]. Retrieved July 24, 2026 from https://archive.ourworldindata.org/20260724-092634/grapher/income-share-top-1-before-tax-wid.html (archived on July 24, 2026).Download
Quick download
Download the data shown in this chart as a ZIP file containing a CSV file, metadata in JSON format, and a README. The CSV file can be opened in Excel, Google Sheets, and other data analysis tools.
Data API
Use these URLs to programmatically access this chart's data and configure your requests with the options below. Our documentation provides more information on how to use the API, and you can find a few code examples below.
Data URL (CSV format)
https://ourworldindata.org/grapher/income-share-top-1-before-tax-wid.csv?v=1&csvType=full&useColumnShortNames=falseMetadata URL (JSON format)
https://ourworldindata.org/grapher/income-share-top-1-before-tax-wid.metadata.json?v=1&csvType=full&useColumnShortNames=falseExcel / Google Sheets
=IMPORTDATA("https://ourworldindata.org/grapher/income-share-top-1-before-tax-wid.csv?v=1&csvType=full&useColumnShortNames=false")Python with Pandas
import pandas as pd
import requests

# Fetch the data.
df = pd.read_csv("https://ourworldindata.org/grapher/income-share-top-1-before-tax-wid.csv?v=1&csvType=full&useColumnShortNames=false", storage_options = {'User-Agent': 'Our World In Data data fetch/1.0'})

# Fetch the metadata
metadata = requests.get("https://ourworldindata.org/grapher/income-share-top-1-before-tax-wid.metadata.json?v=1&csvType=full&useColumnShortNames=false").json()
R
library(jsonlite)

# Fetch the data
df <- read.csv("https://ourworldindata.org/grapher/income-share-top-1-before-tax-wid.csv?v=1&csvType=full&useColumnShortNames=false")

# Fetch the metadata
metadata <- fromJSON("https://ourworldindata.org/grapher/income-share-top-1-before-tax-wid.metadata.json?v=1&csvType=full&useColumnShortNames=false")
Stata
import delimited "https://ourworldindata.org/grapher/income-share-top-1-before-tax-wid.csv?v=1&csvType=full&useColumnShortNames=false", encoding("utf-8") clear