Interactive visualization requires JavaScript
Related research and data
Charts
- Country-level estimates of patience
- Country-level estimates of positive reciprocity
- Happiness inequality during periods of economic growth
- Happiness vs. life satisfaction
- How important family is to people in life
- How important friends are to people in life
- How important leisure is to people in life
- How important politics is to people in life
- How important religion is to people in life
- How important work is to people in life
- Life satisfaction vs. CO₂ emissions per capita
- Life satisfaction vs. child mortality
- Life satisfaction vs. life expectancy
- People who report having friends or relatives they can count on
- Self-reported happiness vs. GDP per capita
- Self-reported life satisfaction
- Self-reported life satisfaction vs. GDP per capita
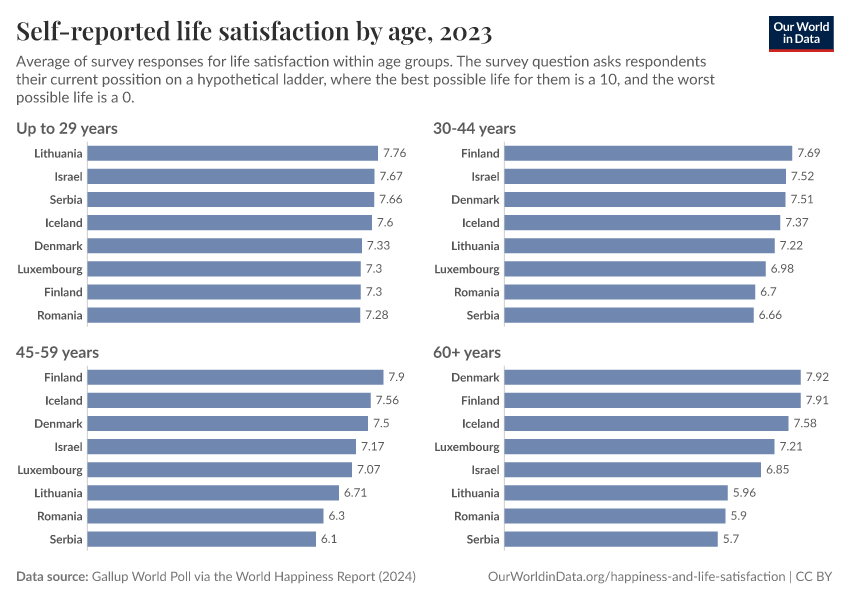
- Self-reported life satisfaction: young vs. old people
- Share of people living with depression vs. self-reported life satisfaction
- Share of people who say they are happy
- Share of people who say they are satisfied with their life
- Share of urban population with convenient access to open public spaces
- Share that feel safe walking alone around the area they live at night