Air conditioning causes around 3% of greenhouse gas emissions. How will this change in the future?
Demand is set to triple by 2050. Can it be met in an energy-efficient way?
Air conditioning is truly a lifesaver for some people in the world. For many more, it makes extreme heat tolerable. Those who work indoors can do so productively, kids can learn better at school, and people can sleep comfortably at night during the summer.1
Research shows that air conditioning (AC) effectively reduces heat mortality during heatwaves. The 2021 Lancet Countdown report estimated that air conditioning prevented almost 200,000 premature deaths in 2019.2
Demand for air conditioning is bound to increase. One reason is climate change: as the world warms, more people will be exposed to heat waves, and those who already live in hot climates will experience more intense ones. But that’s not the only — or even the biggest — driver of demand. The biggest driver is rising incomes.
It’s already extremely hot in countries like India or Indonesia. If people could afford AC today, they would have it.
This will happen over the next few decades as incomes grow in many low-to-middle-income countries.
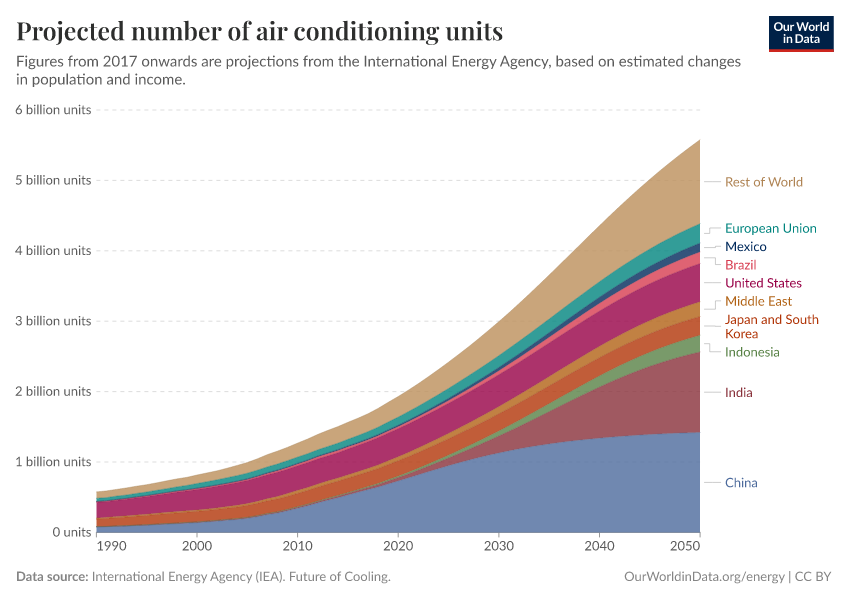
Today, there are around 2 billion air conditioning units in the world. The International Energy Agency (IEA) projects that this could almost triple to over 5.5 billion by 2050, as shown in the chart below.3 Even then, many who need — and would want — AC won’t be able to afford it, so if countries can increase incomes more quickly or AC units get cheaper, then this number could be even higher.
But AC units require a lot of energy to cool us down. How will the world be able to meet the energy demand for AC? And what might the climate impacts of this be?
In this article, I look at the current energy use, and carbon emissions of AC and what they might look like in the future.

Air conditioning accounts for 7% of global electricity and 3% of carbon emissions
First, some grounding on where we are today.
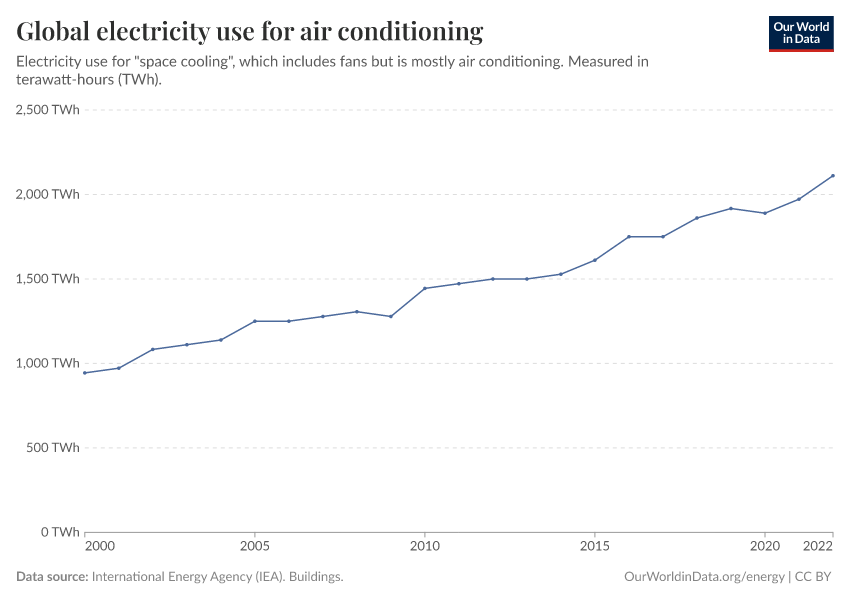
The IEA estimates that “space cooling” — mostly air conditioning but also fans — consumed around 2,100 terawatt-hours (TWh) of power in 2022.
For context, global electricity use in 2022 was around 29,000 TWh. That means AC uses around 7% of the world’s electricity.4 That’s nearly 20% of electricity use in buildings.
You can see the growth in electricity demand for AC since 2000 in the chart below. It has more than doubled in 22 years. This is also exactly in line with growth rates in total electricity use, which increased by 90% between 2000 and 2022.

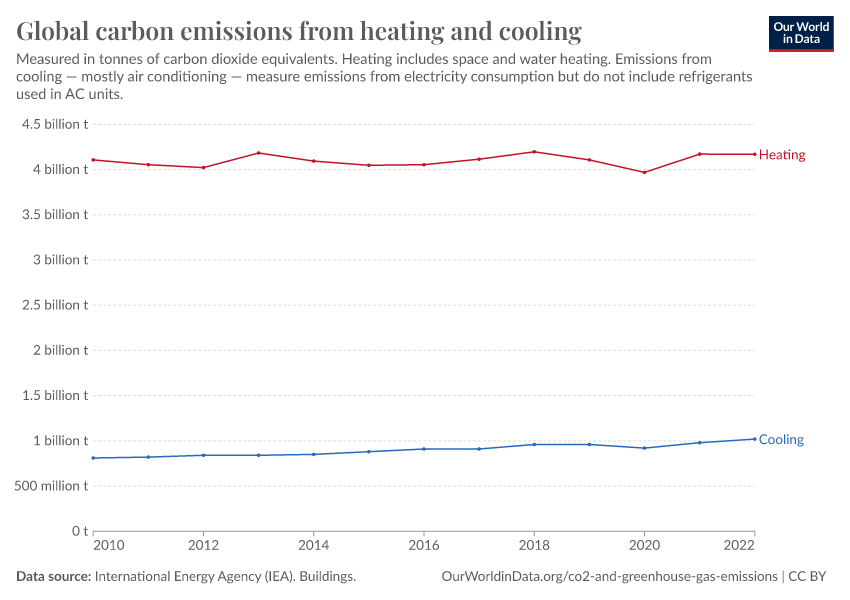
Of course, some of this electricity comes from fossil fuels, so AC is also a driver of carbon emissions. The IEA estimates that space cooling caused around 1 billion tonnes of CO2 from electricity use in 2022.
That’s around 2.7% of total CO2 emissions from fossil fuels and industry.5 Note that this doesn’t yet account for the climate impact of refrigerants used in AC units, which we’ll look at soon.
Keep in mind that this is much lower than global emissions for heating. In the chart below, you can see the comparison of emissions from heating — which includes space and water heating — to space cooling. Heating is responsible for around four times as much emissions.
People might lament the increased energy demand from air conditioning, but I think those in hot climates have as much right to live comfortably as those in colder ones.

These cooling estimates do not include the release of powerful greenhouse gases used as refrigerants. Researchers estimate this adds another 720 million tonnes of carbon dioxide equivalents (CO2eq) to AC’s annual carbon footprint.6
The greenhouse gas emissions from ACs totaled 1,750 tCO2eq, 3.2% of all greenhouse gas emissions in 2022.7
In summary, air conditioning in 2022:
- Used 7% of the world’s electricity;
- Emitted 2.7% of energy-related CO2 emissions;
- Emitted 3.2% of total greenhouse gas emissions when refrigerants are included.
There are ways to limit the rise in energy demand due to air conditioning
If the number of AC units in the world triples by 2050, will energy demand triple, too?
It depends on how efficient they are. You might assume that the solution is to engineer more efficient air conditioners. That’s certainly part of it. However, we can also do a lot to curb energy demand by ensuring people buy the most efficient options today.
The IEA estimates that globally, people buy AC units that are half as efficient as what is already available in stores.
In the chart below, you can see the efficiency of air conditioners across various markets. The dark line shows the average AC unit sold in each market, and the light gray box shows the range of efficiencies commercially available. In high and middle-income countries, people are opting for AC units at the lower end.
The IEA estimates that in a baseline scenario, global electricity use for AC would increase from 2,000 TWh today to more than 6,000 TWh in 2050. If people were to buy efficient units that are already available — doubling the average efficiency of sold AC units — we could reduce this extra demand by about 45%. Electricity use would only double rather than triple.
What barriers stop consumers from buying efficient AC models?
The first barrier is simply a problem of communication. Especially in many low- and middle-income countries, consumer goods often lack clear labeling of efficiency. It’s often not obvious what the energy rating of a given product is. A study of air-conditioning in public and commercial buildings in Ghana found that over 85% of installed units would have ranked as 1-star (the lowest efficiency) on the SEER grading scale if they had standard efficiency labels shown.8
This goes hand-in-hand with improving energy efficiency standards: a consistent labeling system can be combined with minimum standards that force manufacturers to comply. This is no different from other home appliances — such as refrigerators, televisions, and lighting — where efficiency standards have effectively driven innovation and consumer choices.9
The other key barrier is cost. Efficient units often pay off because they’re cheaper to run, but this doesn’t help if consumers can’t afford the higher cost upfront.
I examined the range of AC units available from one of India’s leading brands. The cheapest unit with a 3-star efficiency rating cost around $350.10 The cheapest comparable unit with a 5-star rating costs almost $100 more — a premium of 29%.11 Many families can’t afford the higher cost, so they opt for the less efficient option. Incentivizing or supporting households to make this choice — by reducing taxes on the most efficient goods, for example — will be crucial to reducing the growing energy demand for air conditioning.
Designing cities and buildings for heat can reduce AC demand but won’t eliminate it
Air conditioning is not a silver bullet. It must be combined with other design solutions that make cities and buildings cooler, especially if we want to protect those who work outdoors and the poorest who can’t afford it.
In a previous article, I discussed these architectural and design solutions in detail.
While this could reduce some demand for air conditioning, it’s no replacement. People have the right to live in comfortable conditions, and kids have the right to concentrate at school without intolerable heat. This is especially true in a changing climate, where those at the greatest risk from heat mortality have contributed the least to carbon emissions.
Rather than lamenting air conditioning's impact on energy use, we need to accept that demand for cooling will increase, work on making it affordable for those who need it most, and build efficient solutions that ensure electricity grids worldwide can cope.
This article is part of a series on extreme heat:
Endnotes
Park, R. J., Goodman, J., Hurwitz, M., & Smith, J. (2020). Heat and learning. American Economic Journal: Economic Policy.
Somanathan, E., Somanathan, R., Sudarshan, A., & Tewari, M. (2021). The impact of temperature on productivity and labor supply: Evidence from Indian manufacturing. Journal of Political Economy.
Romanello, M., McGushin, A., Di Napoli, C., Drummond, P., Hughes, N., Jamart, L., ... & Hamilton, I. (2021). The 2021 report of the Lancet Countdown on health and climate change: code red for a healthy future. The Lancet.
International Energy Agency (2018), The Future of Cooling. IEA, Paris.
2,100 / 29,000 * 100 = 7%.
The Global Carbon Project estimates that fossil emissions in 2022 were 37.2 billion tonnes. [1.02 / 37.2 * 100 = 2.7%].
Woods, J., James, N., Kozubal, E., Bonnema, E., Brief, K., Voeller, L., & Rivest, J. (2022). Humidity’s impact on greenhouse gas emissions from air conditioning. Joule.
Matthew Jones et al. (2024) estimate that global greenhouse gas emissions will be approximately 53.85 billion tonnes in 2022. [1750 / 5385 * 100 = 3.2%].
Opoku, R., Edwin, I. A., & Agyarko, K. A. (2019). Energy efficiency and cost-saving opportunities in public and commercial buildings in developing countries–The case of air-conditioners in Ghana. Journal of Cleaner Production.
Schleich, J., Durand, A., & Brugger, H. (2021). How effective are EU minimum energy performance standards and energy labels for cold appliances?. Energy Policy.
The IEA estimates that in countries with long-standing standards and policies, appliances consume around 30% less energy than they would have otherwise.
IEA/4E TCP (2021), Achievements of Energy Efficiency Appliance and Equipment Standards and Labelling Programmes, IEA, Paris.
The sticker price was around 29,000 rupees, equivalent to around 350 US dollars.
The cost of the same sized unit rates 5 stars was around 36,000 rupees. That’s equal to around $430.
Cite this work
Our articles and data visualizations rely on work from many different people and organizations. When citing this article, please also cite the underlying data sources. This article can be cited as:
Hannah Ritchie (2024) - “Air conditioning causes around 3% of greenhouse gas emissions. How will this change in the future?” Published online at OurWorldinData.org. Retrieved from: 'https://archive.ourworldindata.org/20251125-173858/air-conditioning-causes-around-greenhouse-gas-emissions-will-change-future.html' [Online Resource] (archived on November 25, 2025).BibTeX citation
@article{owid-air-conditioning-causes-around-greenhouse-gas-emissions-will-change-future,
    author = {Hannah Ritchie},
    title = {Air conditioning causes around 3% of greenhouse gas emissions. How will this change in the future?},
    journal = {Our World in Data},
    year = {2024},
    note = {https://archive.ourworldindata.org/20251125-173858/air-conditioning-causes-around-greenhouse-gas-emissions-will-change-future.html}
}
Reuse this work freely
All visualizations, data, and code produced by Our World in Data are completely open access under the Creative Commons BY license. You have the permission to use, distribute, and reproduce these in any medium, provided the source and authors are credited.
The data produced by third parties and made available by Our World in Data is subject to the license terms from the original third-party authors. We will always indicate the original source of the data in our documentation, so you should always check the license of any such third-party data before use and redistribution.
All of our charts can be embedded in any site.