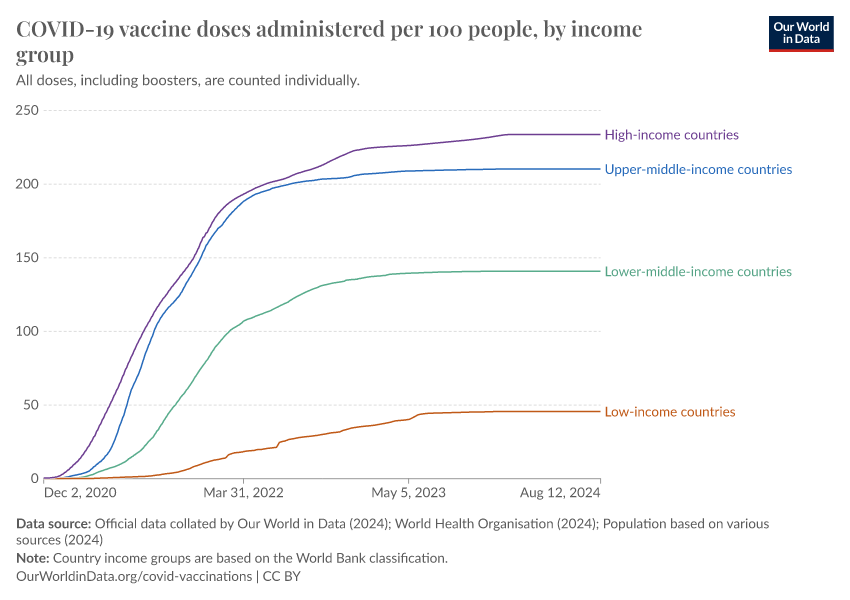
Total COVID-19 vaccine doses administered per 100 people, Aug 12, 2024

All doses, including boosters, are counted individually.

Cumulative COVID-19 vaccinations per 100 people doses
Country/area
Aug 12, 2024
Afghanistan
56.59
Albania
109.24
Algeria
33.57
Andorra
197.14
Angola
78.07
Anguilla
175.54
Antigua and Barbuda
147.10
Argentina
257.62
Armenia
78.34
Aruba
162.34
Australia
265.97
Austria
225.81
Azerbaijan
134.60
Bahamas
92.17
Bahrain
226.73
Bangladesh
213.56
Barbados
136.06
Belarus
248.17
Belgium
270.31
Belize
126.92
Benin
30.76
Bermuda
211.26
Bhutan
257.59
Bolivia
121.64
Bonaire Sint Eustatius and Saba
125.31
Bosnia and Herzegovina
60.07
Botswana
129.99
Brazil
245.47
British Virgin Islands
108.24
Brunei
283.99
Bulgaria
69.25
Burkina Faso
35.07
Burundi
0.32
Cambodia
278.04
Cameroon
17.66
Canada
265.00
Cape Verde
165.47
Cayman Islands
212.62
Central African Republic
65.56
Chad
49.59
Chile
341.97
China
246.77
Colombia
175.75
Comoros
100.11
Congo
13.81
Cook Islands
277.81
Costa Rica
267.17
Cote d'Ivoire
83.12
Croatia
139.13
Cuba
415.88
Curacao
140.48
Cyprus
201.16
Czechia
178.46
Democratic Republic of Congo
18.37
Denmark
253.46
Djibouti
63.65
Dominica
101.27
Dominican Republic
146.31
East Timor
148.17
Ecuador
222.09
Egypt
100.05
El Salvador
182.47
Equatorial Guinea
27.10
Estonia
160.85
Eswatini
71.39
Ethiopia
54.92
Falkland Islands
126.82
Faroe Islands
192.43
Fiji
169.16
Finland
239.30
France
238.48
French Polynesia
179.41
Gabon
23.56
Gambia
54.79
Georgia
77.23
Germany
229.81
Ghana
77.30
Gibraltar
353.31
Greece
215.78
Greenland
142.47
Grenada
77.59
Guatemala
114.21
Guernsey
280.27
Guinea
85.73
Guinea-Bissau
43.73
Guyana
117.80
Haiti
5.91
Honduras
163.18
Hong Kong
281.45
Hungary
172.46
Iceland
237.54
India
154.82
Indonesia
160.74
Iran
173.65
Iraq
44.38
Ireland
218.17
Isle of Man
225.93
Israel
207.10
Italy
252.14
Jamaica
53.86
Japan
346.69
Jersey
258.07
Jordan
89.35
Kazakhstan
191.45
Kenya
43.78
Kiribati
168.65
Kosovo
106.96
Kuwait
180.00
Kyrgyzstan
52.64
Laos
146.99
Latvia
158.41
Lebanon
101.22
Lesotho
58.58
Liberia
83.02
Libya
51.76
Liechtenstein
189.22
Lithuania
163.47
Luxembourg
210.41
Macao
255.99
Madagascar
10.16
Malawi
41.34
Malaysia
209.41
Maldives
181.61
Mali
25.67
Malta
266.74
Mauritania
83.60
Mauritius
205.00
Mexico
173.51
Moldova
75.43
Monaco
184.87
Mongolia
167.40
Montenegro
110.51
Montserrat
104.31
Morocco
148.38
Mozambique
107.03
Myanmar
173.89
Namibia
34.81
Nauru
272.91
Nepal
210.76
Netherlands
222.09
New Caledonia
167.44
New Zealand
260.78
Nicaragua
230.41
Niger
29.13
Nigeria
59.62
Niue
271.69
North Macedonia
101.24
Norway
238.62
Oman
150.28
Pakistan
139.92
Palestine
70.66
Panama
209.09
Papua New Guinea
7.23
Paraguay
147.25
Peru
273.07
Philippines
166.12
Poland
152.75
Portugal
271.81
Qatar
263.07
Romania
87.80
Russia
128.71
Rwanda
200.15
Saint Helena
148.07
Saint Kitts and Nevis
137.70
Saint Lucia
68.80
Saint Vincent and the Grenadines
71.99
Samoa
210.52
San Marino
203.54
Sao Tome and Principe
116.62
Saudi Arabia
213.00
Senegal
18.03
Serbia
125.67
Seychelles
178.96
Sierra Leone
110.62
Singapore
270.85
Sint Maarten (Dutch part)
158.71
Slovakia
131.96
Slovenia
143.17
Solomon Islands
80.15
Somalia
59.30
South Africa
67.01
South Korea
250.37
South Sudan
39.61
Spain
249.28
Sri Lanka
175.68
Sudan
58.04
Suriname
89.00
Sweden
269.97
Switzerland
192.68
Syria
22.66
Taiwan
291.03
Tajikistan
202.00
Tanzania
60.87
Thailand
198.84
Togo
37.66
Tokelau
235.70
Tonga
194.97
Trinidad and Tobago
106.44
Tunisia
136.59
Turkey
175.22
Turkmenistan
232.03
Turks and Caicos Islands
161.28
Tuvalu
268.69
Uganda
55.81
Ukraine
87.06
United Arab Emirates
243.33
United Kingdom
221.84
United States
198.14
Uruguay
266.53
Uzbekistan
240.24
Vanuatu
117.13
Venezuela
134.20
Vietnam
267.35
Wallis and Futuna
157.70
Yemen
3.40
Zambia
67.56
Zimbabwe
86.72
Other
Africa
60.67
Asia
194.49
Europe
190.75
European Union (27)
217.76
High-income countries
233.77
Low-income countries
45.70
Lower-middle-income countries
140.93
North America
193.10
Oceania
198.00
South America
231.31
Upper-middle-income countries
210.33
World
171.88
Data

Total COVID-19 vaccine doses administered per 100 people
See all data and research on:

What you should know about this indicator

  • Vaccination data reflects the total number of doses administered—covering both primary series and booster doses—and are now sourced exclusively from WHO.
  • Rapid vaccine development and ongoing updates for emerging variants underline the dynamic nature of COVID-19 vaccination efforts globally.
  • Coverage statistics can exceed 100% if population estimates do not keep pace with migration or demographic changes, leading to inaccuracies in denominators. Also, we rely on population estimates in 2022 by UN WPP.
Total COVID-19 vaccine doses administered per 100 people
Total number of COVID-19 vaccination doses administered per 100 people in the total population.
Source
Official data collated by Our World in Data (2024); World Health Organisation (2025); Population based on various sources (2024) – with major processing by Our World in Data
Last updated
August 14, 2024
Unit
doses per hundred people

Sources and processing

This data is based on the following sources

Country-by-country data on global COVID-19 vaccinations. We only rely on figures that are verifiable based on public official sources.

This dataset includes some subnational locations (England, Northern Ireland, Scotland, Wales, Northern Cyprus…) and international aggregates (World, continents, European Union…).

The data produced by third parties and made available by Our World in Data is subject to the license terms from the original third-party authors. We will always indicate the original source of the data in our database, and you should always check the license of any such third-party data before use.

Retrieved on
August 14, 2024
Citation
This is the citation of the original data obtained from the source, prior to any processing or adaptation by Our World in Data. To cite data downloaded from this page, please use the suggested citation given in Reuse This Work below.
Mathieu, E., Ritchie, H., Ortiz-Ospina, E. et al. A global database of COVID-19 vaccinations. Nat Hum Behav (2021). https://doi.org/10.1038/s41562-021-01122-8
The data has been obtained from different sources depending on the country. Find below a list of the sources last use for each country. Note that this list may not be exhaustive and that the data sources may have changed prior to the last update (find the complete list on Our World in Data GitHub repository).

COVID-19 vaccination data are collected via WHO regional office-specific systems for monitoring COVID-19 vaccination uptake. These data are pooled from numerous sources, including direct reports from Member States, WHO review of publicly available official data, or data collated and published by third-party sites. Data published by third-party sites have not been validated by WHO, and WHO cannot comment on accuracy or completeness. Differences in counts may occur compared to other sources, due to different inclusion criteria and data cut-off times.

Retrieved on
August 14, 2024
Citation
This is the citation of the original data obtained from the source, prior to any processing or adaptation by Our World in Data. To cite data downloaded from this page, please use the suggested citation given in Reuse This Work below.
WHO COVID-19 Dashboard. Geneva: World Health Organization, 2020. Available online: https://covid19.who.int/

Our World in Data builds and maintains a long-run dataset on population by country, region, and for the world, based on various sources.

You can find more information on these sources and how our time series is constructed on this page: https://ourworldindata.org/population-sources

Retrieved on
July 11, 2024
Citation
This is the citation of the original data obtained from the source, prior to any processing or adaptation by Our World in Data. To cite data downloaded from this page, please use the suggested citation given in Reuse This Work below.
The long-run data on population is based on various sources, described on this page: https://ourworldindata.org/population-sources

How we process data at Our World in Data

All data and visualizations on Our World in Data rely on data sourced from one or several original data providers. Preparing this original data involves several processing steps. Depending on the data, this can include standardizing country names and world region definitions, converting units, calculating derived indicators such as per capita measures, as well as adding or adapting metadata such as the name or the description given to an indicator.

At the link below you can find a detailed description of the structure of our data pipeline, including links to all the code used to prepare data across Our World in Data.

Read about our data pipeline
Notes on our processing step for this indicator

Per-capita values have been estimated by using the population in 2022 as a reference.

Reuse this work

  • All data produced by third-party providers and made available by Our World in Data are subject to the license terms from the original providers. Our work would not be possible without the data providers we rely on, so we ask you to always cite them appropriately (see below). This is crucial to allow data providers to continue doing their work, enhancing, maintaining and updating valuable data.
  • All data, visualizations, and code produced by Our World in Data are completely open access under the Creative Commons BY license. You have the permission to use, distribute, and reproduce these in any medium, provided the source and authors are credited.

Citations

How to cite this page

To cite this page overall, including any descriptions, FAQs or explanations of the data authored by Our World in Data, please use the following citation:

“Data Page: Total COVID-19 vaccine doses administered per 100 people”, part of the following publication: Edouard Mathieu, Hannah Ritchie, Lucas Rodés-Guirao, Cameron Appel, Daniel Gavrilov, Charlie Giattino, Joe Hasell, Bobbie Macdonald, Saloni Dattani, Diana Beltekian, Esteban Ortiz-Ospina, and Max Roser (2020) - “COVID-19 Pandemic”. Data adapted from Official data collated by Our World in Data, World Health Organisation, Various sources. Retrieved from https://ourworldindata.org/grapher/covid-vaccination-doses-per-capita [online resource]
How to cite this data

In-line citationIf you have limited space (e.g. in data visualizations), you can use this abbreviated in-line citation:

Official data collated by Our World in Data (2024); World Health Organisation (2025); Population based on various sources (2024) – with major processing by Our World in Data

Full citation

Official data collated by Our World in Data (2024); World Health Organisation (2025); Population based on various sources (2024) – with major processing by Our World in Data. “Total COVID-19 vaccine doses administered per 100 people” [dataset]. Official data collated by Our World in Data, “COVID-19, vaccinations”; World Health Organisation, “COVID-19, vaccinations (WHO)”; Various sources, “Population” [original data]. Retrieved April 21, 2025 from https://ourworldindata.org/grapher/covid-vaccination-doses-per-capita