Data

Daily cost of a healthy diet
See all data and research on:

What you should know about this indicator

A healthy diet meets nutritional standards set by dietary guidelines, with sufficient diversity and quantity within and between food groups to achieve nutrient adequacy and protect against diet-related diseases.

The Cost of a Healthy Diet indicator provides a globally standardized metric to monitor food environments, measuring a population’s access to sufficient food for an active and healthy life. For this metric, access to healthy diets is measured using the least expensive locally available items in sufficient quantities to meet national governments’ food-based dietary guidelines. For global monitoring, commonalities among those guidelines are represented by a Healthy Diet Basket, specifying a target number and quantity of eleven items balanced across six nutritionally defined food groups. The items selected in each country to meet the global Healthy Diet Basket standard generally also achieve nutrient adequacy, at a similar cost to meeting an individual country’s own national dietary guidelines.

Limitations and exceptions

Item prices for the global Cost of a Healthy Diet indicator are reported by each national statistical organization through the International Comparison Program, intending to show the country’s annual average cost for commonly consumed foods being sold in multiple countries. Food item availability and price at any one time and place could differ from this average. Also, prices are reported in local currency units, and then adjusted for inflation over time and price levels across countries using national Consumer Price Indexes and Purchasing Power Parity exchange rates that may not exactly match currency values used in any one time and place.

Statistical concept and methodology

The Cost of a Healthy Diet is a new kind of price index developed by the Food Prices for Nutrition project, based on matching item descriptions to food composition data then selecting the lowest cost options to meet dietary requirements. The initial methods were first published as a background paper for the UN agencies’ State of Food Security and Nutrition in the World Report 2020 and revised for the 2022 and 2024 editions of that same report.

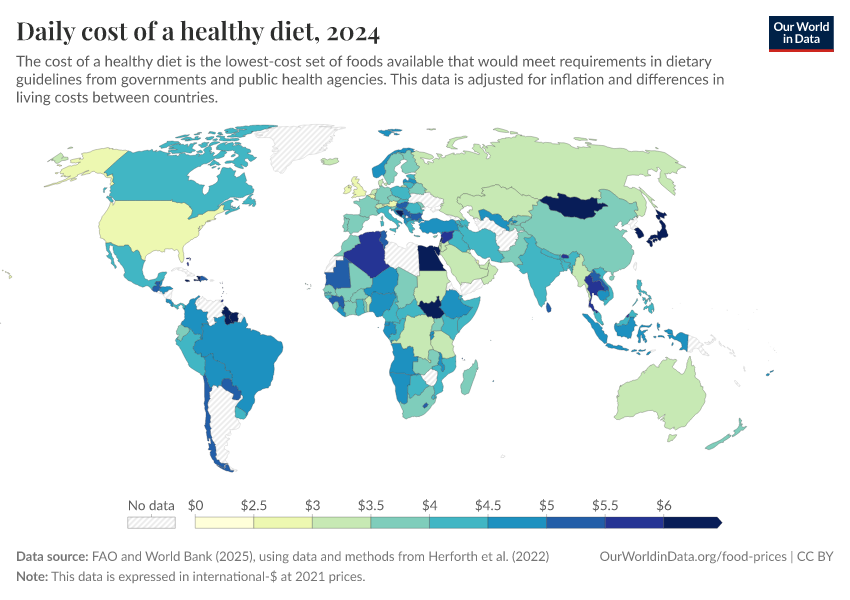
Daily cost of a healthy diet
Cost of purchasing the least expensive locally available foods to meet requirements for energy and food-based dietary guidelines, for a representative person within energy balance at 2,330 kcal/day. This data is adjusted for inflation and for differences in the cost of living between countries.
Source
FAO and World Bank (2024), using data and methods from Herforth et al. (2022); Multiple sources compiled by World Bank (2024) – with major processing by Our World in Data
Last updated
September 9, 2024
Next expected update
September 2025
Date range
2017–2022
Unit
international-$ in 2021 prices per person per day

Sources and processing

This data is based on the following sources

Food Prices for Nutrition provides indicators on the cost and affordability of healthy diets in each country, showing the population's physical and economic access to sufficient quantities of locally available items for an active and healthy life. It also provides indicators on the cost and affordability of an energy-sufficient diet and of a nutrient-adequate diet. These indicators are explained in detail in the Food Prices for Nutrition DataHub.

Version 3.0, estimated in July 2024, uses the 2021 global food retail price data from the International Comparison Program (ICP) and updates the methodology of calculating the affordability indicators, including indicators measuring the ratio between diet costs and international food poverty lines and indicators measuring the share and volume of the population unable to afford each diet, and they are based on the latest Poverty and Inequality Platform (PIP) data expressed in 2017 purchasing power parity dollars (PPP).

Estimates for the prevalence and number of people unable to afford a healthy diet were imputed for countries with missing information based on their regional and global aggregates. Countries' income classifications at the aggregate reporting level follow the calendar year of 2022 standard (the fiscal year of 2024 of the World Bank).

Population data are sourced from the United Nations Department of Economic and Social Affairs (UN DESA) 2022 revision of the World Population Prospects and World Development Indicators (WDI) of the World Bank. The WDI source data from:

  • The United Nations Population Division. World Population Prospects: 2022 Revision.
  • Census reports and other statistical publications from national statistical offices.
  • Eurostat: Demographic Statistics.
  • United Nations Statistical Division. Population and Vital Statistics Report (various years).
  • U.S. Census Bureau: International Database.
  • Secretariat of the Pacific Community: Statistics and Demography Programme.
Retrieved on
September 9, 2024
Citation
This is the citation of the original data obtained from the source, prior to any processing or adaptation by Our World in Data. To cite data downloaded from this page, please use the suggested citation given in Reuse This Work below.

The World Development Indicators (WDI) is the primary World Bank collection of development indicators, compiled from officially-recognized international sources. It presents the most current and accurate global development data available, and includes national, regional and global estimates.

Retrieved on
May 20, 2024
Citation
This is the citation of the original data obtained from the source, prior to any processing or adaptation by Our World in Data. To cite data downloaded from this page, please use the suggested citation given in Reuse This Work below.
World Bank's World Development Indicators (WDI).

How we process data at Our World in Data

All data and visualizations on Our World in Data rely on data sourced from one or several original data providers. Preparing this original data involves several processing steps. Depending on the data, this can include standardizing country names and world region definitions, converting units, calculating derived indicators such as per capita measures, as well as adding or adapting metadata such as the name or the description given to an indicator.

At the link below you can find a detailed description of the structure of our data pipeline, including links to all the code used to prepare data across Our World in Data.

Read about our data pipeline
Notes on our processing step for this indicator
  • Costs have been adjusted for inflation by multiplying the cost for a given year by CPI(BASE_YEAR) / CPI(year), where CPI is the United States' Consumer Price Index and the base year is 2021.

Reuse this work

  • All data produced by third-party providers and made available by Our World in Data are subject to the license terms from the original providers. Our work would not be possible without the data providers we rely on, so we ask you to always cite them appropriately (see below). This is crucial to allow data providers to continue doing their work, enhancing, maintaining and updating valuable data.
  • All data, visualizations, and code produced by Our World in Data are completely open access under the Creative Commons BY license. You have the permission to use, distribute, and reproduce these in any medium, provided the source and authors are credited.

Citations

How to cite this page

To cite this page overall, including any descriptions, FAQs or explanations of the data authored by Our World in Data, please use the following citation:

“Data Page: Daily cost of a healthy diet”, part of the following publication: Hannah Ritchie, Pablo Rosado and Max Roser (2023) - “Food Prices”. Data adapted from Herforth et al. (2022), adapted by World Bank, International Monetary Fund (via World Bank). Retrieved from https://ourworldindata.org/grapher/cost-healthy-diet [online resource]
How to cite this data

In-line citationIf you have limited space (e.g. in data visualizations), you can use this abbreviated in-line citation:

FAO and World Bank (2024), using data and methods from Herforth et al. (2022); Multiple sources compiled by World Bank (2024) – with major processing by Our World in Data

Full citation

FAO and World Bank (2024), using data and methods from Herforth et al. (2022); Multiple sources compiled by World Bank (2024) – with major processing by Our World in Data. “Daily cost of a healthy diet” [dataset]. Herforth et al. (2022), adapted by World Bank, “Food Prices for Nutrition 3.0”; International Monetary Fund (via World Bank), “World Development Indicators” [original data]. Retrieved January 9, 2025 from https://ourworldindata.org/grapher/cost-healthy-diet