Estimation of the number of paralytic polio cases by region
Only a fraction of all polio cases are reported. Here we apply a method by Tebbens et al. (2010) to estimate the actual number of global polio cases.
This article was first published in April 2018. It was last updated in May 2022.
In this post we explain how we estimate the number of cases of paralytic polio by country and region. To summarize, we apply a method by Tebbens et al. (2010) to the reported cases, using two measures of testing quality.
The number of reported cases of paralytic polio can be an underestimate of the number of actual cases for several reasons. People with acute flaccid paralysis (AFP) may not be seen by doctors or healthcare workers and reported as suspected cases of polio. They may not have samples taken, or taken in time, to detect the presence of poliovirus. Or their samples may not be tested for poliovirus and reported.
Adapted methodology from Tebbens et al. (2010)
In their paper, Tebbens et al. (2010) introduced a method to adjust for under-detection.1
Their method uses two indicators: non-polio AFP rate and AFP cases with adequate stool collection.
The non-polio AFP rate is the rate at which cases of AFP from non-polio causes are detected and reported. This indicates whether AFP is being detected and reported sufficiently.
The metric called 'AFP cases with adequate stool collection' is the share of suspected cases that have testable stool samples taken from them. To test for the poliovirus, two samples need to be taken between 24–48 hours apart, within 14 days of the onset of paralysis.2
Tebbens et al. used these two indicators to derive a 'correction factor'. Then, the number of reported cases was multiplied by this correction factor to estimate the number of actual cases.
In their paper, they estimated cases from 1980 to 2009 for countries that received GPEI support. However, here we adapt this method by applying it to all countries that reported data to the WHO from 1980 to 2020.
Up to 1995: Surveillance data from the WHO was not available, so they applied a correction factor of 7 for all countries that received GPEI support to account for under-detection.
Between 1996 and 2000: Polio surveillance was rapidly expanding, and surveillance data was provided to researchers by the WHO. This means Tebbens et al. (2010) applied a correction factor for the countries that received GPEI support based on the surveillance data to account for under-detection. They applied a correction factor of 7 when a country reported a non-polio AFP rate <1 or an adequate stool collection <60%. They applied a correction factor of 2 when a country reported a non-polio AFP rate <2 or an adequate stool collection <80%. Otherwise, they applied a correction factor of 1.11.
Since this data is not publicly available, we apply a correction factor of 1.11 to all countries during this time period to match their average correction factor. However, as noted above, we apply this to all countries, including those that did not receive GPEI support.
Post-2000: After this, they applied a correction factor of 7 when a country reported a non-polio AFP rate <1 or an adequate stool collection <60%. They applied a correction factor of 2 when a country reported a non-polio AFP rate <2 or an adequate stool collection <80%. Otherwise, they applied a correction factor of 1.11.
They also made two exceptions in footnote (a) of Table 1, justifying their use of a correction factor of 1.11 for China from 1989–1992 and Oman in 1988 because they had large active investigations into outbreaks.
Results: comparison of reported cases vs. estimated cases
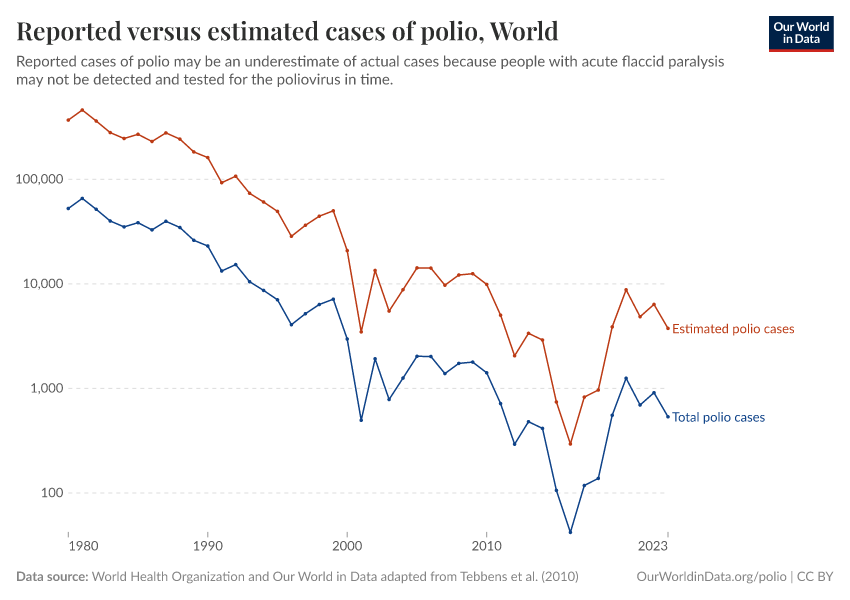
In this chart you can compare the estimated number of polio cases with the number of reported cases.
It is important to note that these are rough estimates of the number of paralytic polio cases based on metrics of testing quality (non-polio AFP rate and AFP cases with adequate stool collection). Data on testing quality by country is not available before 2000.

Results: estimated cases by region
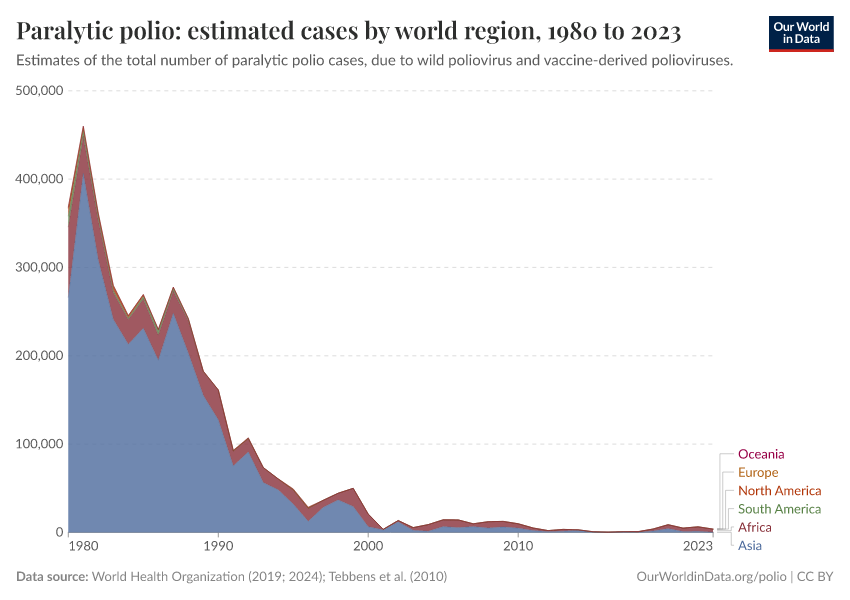
This chart shows the results of this method by region. Using the adapted methodology based on Tebbens et al. (2010), there were around 370,000 paralytic polio cases worldwide in 1980. Since then, the number of cases has declined in all regions. Today, the world is very close to the goal of eradicating this disease globally.

Endnotes
Duintjer Tebbens, R. J., Pallansch, M. A., Cochi, S. L., Wassilak, S. G. F., Linkins, J., Sutter, R. W., Aylward, R. B., & Thompson, K. M. (2010). Economic analysis of the global polio eradication initiative. Vaccine, 29(2), 334–343. https://doi.org/10.1016/j.vaccine.2010.10.026
Their stool samples should then be processed in a GPEI-accredited laboratory for the presence of the poliovirus. If they test positive, they are considered a 'confirmed case' of polio. WHO-recommended surveillance standard of poliomyelitis. (n.d.). World Health Organization. https://web.archive.org/web/20210423203212/https://www.who.int/immunization/monitoring_surveillance/burden/vpd/surveillance_type/active/poliomyelitis_standards/en/
Cite this work
Our articles and data visualizations rely on work from many different people and organizations. When citing this article, please also cite the underlying data sources. This article can be cited as:
Saloni Dattani and Fiona Spooner (2022) - “Estimation of the number of paralytic polio cases by region” Published online at OurWorldinData.org. Retrieved from: 'https://archive.ourworldindata.org/20260119-065148/estimating-total-global-paralytic-polio-cases.html' [Online Resource] (archived on January 19, 2026).BibTeX citation
@article{owid-estimating-total-global-paralytic-polio-cases,
    author = {Saloni Dattani and Fiona Spooner},
    title = {Estimation of the number of paralytic polio cases by region},
    journal = {Our World in Data},
    year = {2022},
    note = {https://archive.ourworldindata.org/20260119-065148/estimating-total-global-paralytic-polio-cases.html}
}
Reuse this work freely
All visualizations, data, and code produced by Our World in Data are completely open access under the Creative Commons BY license. You have the permission to use, distribute, and reproduce these in any medium, provided the source and authors are credited.
The data produced by third parties and made available by Our World in Data is subject to the license terms from the original third-party authors. We will always indicate the original source of the data in our documentation, so you should always check the license of any such third-party data before use and redistribution.
All of our charts can be embedded in any site.