Who would have won the Simon-Ehrlich bet over different decades, and what do long-term prices tell us about resource scarcity?
In the 1980s, economist Julian Simon won his bet with biologist Paul Ehrlich on material prices. But what does the long-term data tell us about supply and demand for resources?
In 1980, the biologist Paul Ehrlich agreed to a bet with the economist Julian Simon on how the prices of five materials would change over the next decade.
Paul Ehrlich had a clear expectation. He thought population growth would quickly deplete the planet’s resources.1 As a consequence, he expected that the cost of resources — including minerals — would rise steeply as they became more scarce.2
This claim got the attention of Julian Simon, who expected the opposite. Simon thought that human innovation and ingenuity would overcome resource shortages, and the price of resources would, therefore, not rise but fall. In the pages of the Social Science Quarterly, he challenged Ehrlich to put money on the line.
Simon offered Ehrlich the chance to choose any resource he wanted for the bet. Ehrlich chose five: chromium, copper, nickel, tin, and tungsten. The two bet $1,000 — $200 on each metal — on whether inflation-adjusted prices of these resources in September 1990 would be higher or lower than they were in September 1980.3 If prices had increased, Ehrlich would win. If they had fallen, victory would go to Simon.
The chart below shows us the change in the price of the five materials in 1990 compared to 1980. Note that this is based on the average prices that year, not necessarily the price in September of each year. But the final results of the bet are the same, regardless of whether you take annual average prices or those specifically in September.
All five had become cheaper, so Simon won the bet (and Ehrlich did mail him the check).
The cost of tungsten and tin was more than 60% lower. Copper was around 20% cheaper. Nickel and chromium were only slightly cheaper than a decade before. None of them had increased in price, contrary to Ehrlich’s prediction.

There has been lots of debate about whether Simon “got lucky” with this bet.4
The chart above shows that he got a bit lucky on nickel and chromium. If the bet had ended in 1989 rather than 1990, the price of these two materials would have been higher.
But a more general way to analyze this wager bet is to ask who would have won if it had occurred in any other decade of the 20th and early 21st centuries.
I looked at inflation-adjusted price data — from the United States Geological Survey — for these five materials since 1900. I then calculated who would have won in each decade if they had made a bet on each of the five metals separately.
If the average annual price at the end of a given decade (for example, 1930) were lower than at the beginning (e.g., 1920), then Simon would win that decade. If the price was higher, Ehrlich did.
Have a look at the chart to see the result. The price of all five elements varied quite a bit over time. Look at chromium at the very top, for example. In some decades, the price fell. In others, it went up. Whenever the price was higher at the end of the decade than at the beginning, Ehrlich would have won — those segments of the line I have colored red. Simon would have won when the price fell between the beginning and the end of a decade — the line segments colored blue.
It’s a pretty even split. Simon and Ehrlich would both have won around half the time. But as I’ll explain, I think the long-term data tells us a slightly different story: one that’s more in line with Simon’s worldview than Ehrlich’s.
The Simon-Ehrlich bet was a poor test for their contrasting worldviews
This bet has come to represent a clash of worldviews: are we exhausting the planet of its resources, or can humans effectively respond to scarcity to ensure we don’t run out?
Understanding which of these models of the world is more “correct” matters a lot for my work on sustainability. This motivated me to dig into the data on the Simon-Ehrlich wager in more detail.
But the more I reflected on it, the more it seemed that the original bet didn’t capture Simon and Ehrlich’s contrasting worldviews very well.
Looking at mineral prices over just ten years doesn’t reflect either’s viewpoint.
Ehrlich’s core argument was that human demand would vastly outstrip the planet’s available resources.6 His argument is that prices will increase significantly over the long run as resources get increasingly scarce.
Simon’s viewpoint was that this shouldn’t happen. As resources become scarcer — and prices increase to reflect this — human innovation and changes in supply should respond and bring prices back down.
In other words, both worldviews are about changes in the long run.
Simon, in particular, was very specific about this in his initial claim for the wager: “to stake US$10,000... on my belief that the cost of non-government-controlled raw materials (including grain and oil) will not rise in the long run”. The emphasis is on “in the long run”.
The problem is that Simon and Ehrlich agreed to a bet about short-term changes.
Their decade-long wager was vulnerable to short-term fluctuations, which often had nothing to do with actual changes in physical supply and demand. Instead, they were influenced by geopolitical or temporary economic forces. That means either could have won depending on random year-to-year fluctuations that didn’t reflect their worldview.
A more meaningful test for their arguments is the change in prices over the long run, which is a signal of the trend rather than noise.
Long-term data brings me closer to Simon’s view of resource scarcity
With all that in mind, here’s why the long-run data makes me side more with Simon’s view than Ehrlich’s.
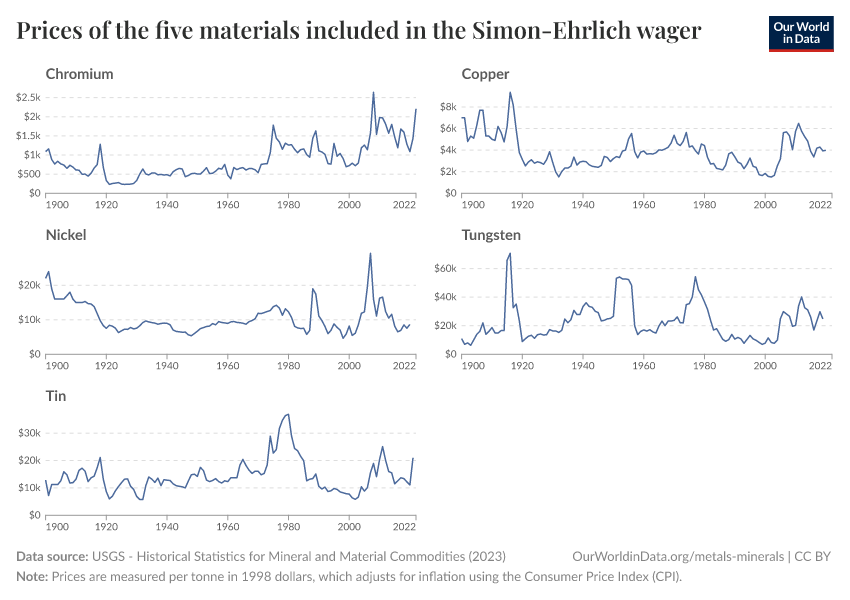
Let’s look at the century-long price trends of the five materials again. They’re shown in the chart below.
The key takeaway for me is that, over the long run, prices didn’t change dramatically. A lot has changed since 1900, but the prices of the five metals are, surprisingly, not much different from what they were in 1900. Chromium is, perhaps, the one exception where average prices in the last few decades have been higher than they were in the early 20th century (although prices in 2020 were exactly the same as they were in 1900).
Overall, material values have fluctuated up and down but around a reasonably consistent level. The time series are noisy, but the signal is that prices have not changed much over more than a century.
Studies stretching as far back as 1840 find that mineral prices — across many more than the five below — “have been basically trend-less” over the long term.7
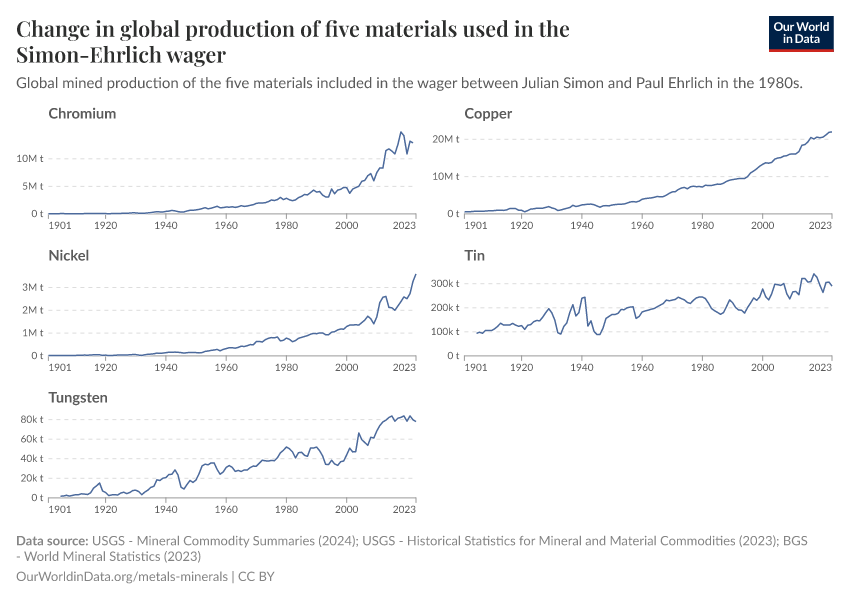
Crucially, this is despite the fact that the world produces much more of these materials. The chart below shows the change in global production of each of the five materials since 1900.
Today, the world produces 40 times as much copper annually and 250 times as much nickel as it did in 1900.
The fact that we produce far more materials than we did in the past, yet prices have barely changed, suggests that contrary to Ehrlich’s prediction, we’re not close to running out of these materials any time soon. That is what brings me closer to Simon’s worldview.
Acknowledgments
Many thanks to Max Roser, Simon van Teutem, Saloni Dattani, and Edouard Mathieu for their comments and feedback on this article.
Endnotes
This is Paul R. Ehrlich, most famous for his 1968 book The Population Bomb. It was not the Nobel-winning physician Paul Ehrlich who died in 1915.
Ehrlich even went as far as suggesting that England would not exist in the year 2000. His exact quote was: “If I were a gambler, I would take even money that England will not exist in the year 2000.”
The bet was based on inflation-adjusted prices using the Consumer Price Index (CPI). In the following analysis, I use prices from the United States Geological Survey, which also uses the CPI to convert nominal prices into real prices.
Emmett, R. B., & Grabowski, J. (2022). Better lucky than good: The Simon-Ehrlich bet through the lens of financial economics. Ecological Economics.
A paper by Emmett and Grabowski gives an overview of the literature exploring who would have “won” the bet during different periods or with a different basket of goods.
Emmett, R. B., & Grabowski, J. (2022). Better lucky than good: The Simon-Ehrlich bet through the lens of financial economics. Ecological Economics.
Other analyses on this include:
Pooley, G., & Tupy, M. (2020). Luck or insight? The Simon–Ehrlich bet re‐examined. In Economic Affairs.
Kiel, K., Matheson, V., & Golembiewski, K. (2010). Luck or skill? An examination of the Ehrlich–Simon bet. In Ecological Economics.
Perry, M. J. (2008). Would Julian Simon Have Won a Second Bet?. Available at: https://archive.vn/wip/AYSnC
McClintick, D., & Emmett, R. B. (2005). Betting on the Wealth of Nature. The Simon-Ehrlich wager. In PERC Reports.
Liu, J., & Fitzpatrick, T. (2021). A 40th Anniversary Redux of the Simon and Ehrlich Bet. In Management.
This is based on the inflation-adjusted prices of the five metals in the Simon-Ehrlich bet. Price data comes from the United States Geological Survey and is adjusted for inflation using the Consumer Price Index (CPI). The CPI was the adjustment that was also used in the original wager.
Another key point is that much of Ehrlich’s work was focused on food supply. He predicted widespread food shortages and large-scale famines (which did not come true; the food supply per person has increased since the 1980s). So it’s not obvious to me why he agreed to a bet on materials or why he chose those five ones in particular.
Stuermer, M. (2018). 150 years of boom and bust: what drives mineral commodity prices?. In Macroeconomic Dynamics.
Cite this work
Our articles and data visualizations rely on work from many different people and organizations. When citing this article, please also cite the underlying data sources. This article can be cited as:
Hannah Ritchie (2025) - “Who would have won the Simon-Ehrlich bet over different decades, and what do long-term prices tell us about resource scarcity?” Published online at OurWorldinData.org. Retrieved from: 'https://archive.ourworldindata.org/20251217-135836/simon-ehrlich-bet.html' [Online Resource] (archived on December 17, 2025).BibTeX citation
@article{owid-simon-ehrlich-bet,
    author = {Hannah Ritchie},
    title = {Who would have won the Simon-Ehrlich bet over different decades, and what do long-term prices tell us about resource scarcity?},
    journal = {Our World in Data},
    year = {2025},
    note = {https://archive.ourworldindata.org/20251217-135836/simon-ehrlich-bet.html}
}
Reuse this work freely
All visualizations, data, and code produced by Our World in Data are completely open access under the Creative Commons BY license. You have the permission to use, distribute, and reproduce these in any medium, provided the source and authors are credited.
The data produced by third parties and made available by Our World in Data is subject to the license terms from the original third-party authors. We will always indicate the original source of the data in our documentation, so you should always check the license of any such third-party data before use and redistribution.
All of our charts can be embedded in any site.

