What is obesity and how is it measured?
Obesity is a leading risk factor for poor health outcomes. How is obesity defined and measured?
Obesity is a measure that is commonly used to track changes in health and nutrition across a population. It is important in public health because there is significant evidence to suggest that obesity can put individuals at a higher risk of various negative outcomes including cardiovascular disease, diabetes, certain cancers, stroke, among others.
The World Health Organization provides data on the prevalence of obesity across the world, in both adults and children. However, how they are defined and measured is different in these demographics.
Here I detail how obesity is defined and measured.
Adult obesity
Obesity is defined based on the metric, body mass index (BMI).
Body mass index is used to measure someone’s weight in relation to their height. Rather than basing assessments of obesity solely on someone’s weight, it follows the logic that, on average, we might expect taller people to be heavier.
BMI is calculated by dividing someone’s weight (in kilograms) by the square of their height (in meters):
BMI (kg/m²) = (Weight, in kilograms) / (Height, in meters)²
For example, if we have someone that weighs 70 kilograms, and is 1.75 meters tall, their BMI is calculated as:
[70 / (1.75)²] = 22.9
The BMI scale then defines categories based on the following thresholds:
- Underweight: a BMI equal to or less than 18.5
- Healthy: a BMI between 18.5 and 24.9
- Overweight: a BMI between 25 and 29.9
- Obese: a BMI equal to or greater than 30
For both adult men and adult women, obesity is therefore defined as having a BMI equal to or greater than 30. The prevalence of obesity in a population is the share of adults – aged 18 years and older – that have a BMI of 30 or higher.
We also provide data on the share of adults that are either overweight or obese. This means having a BMI equal to or greater than 25.
BMI is not a perfect metric to understand the health risks associated with weight and body composition. Below we discuss the potential drawbacks to this measure. However, especially at a population level, BMI does provide a good indicator of elevated risk of adverse health outcomes.

Childhood and adolescent obesity
Child and adolescent obesity is also defined on the basis of height and weight, but not using the same thresholds used in adults. The WHO measures childhood obesity relative to its reference WHO Child Growth Standards. This sets out an expected range for healthy height and weight development through childhood.
Children under five years old
For children under five years old, overweight and obesity is defined as the following:
- Overweight: a child is defined as overweight if their weight-for-height is more than two standard deviations from the median of the World Health Organization (WHO) Child Growth Standards.
- Obese: a child is defined as obese if their weight-for-height is more than three standard deviations from the median.

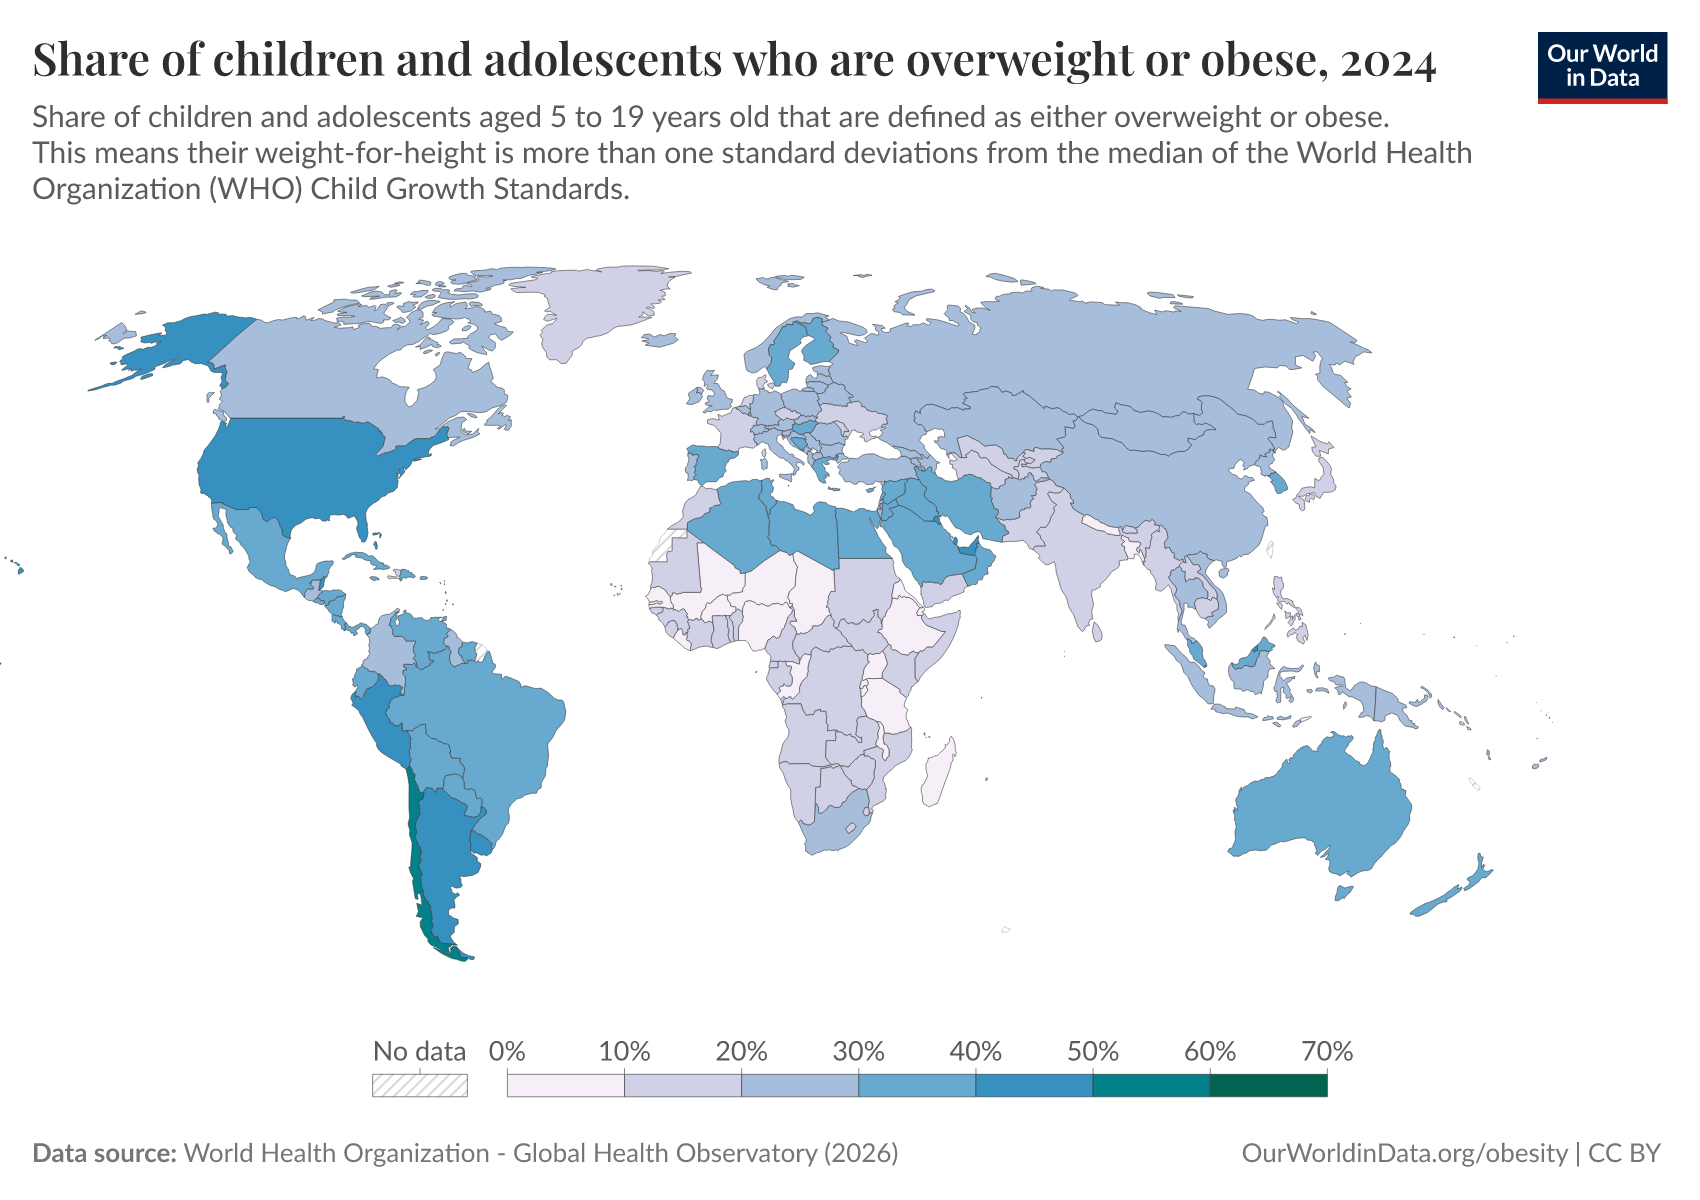
Children and adolescents from 5 to 19 years old
For children and adolescents from 5 to 19 years old, overweight and obesity is defined as the following:
- Overweight: a child is defined as overweight if their weight-for-height is more than one standard deviations from the median of the World Health Organization (WHO) Child Growth Standards.
- Obese: a child is defined as obese if their weight-for-height is more than two standard deviations from the median.
Limitations of using body mass index (BMI) to assess health risk
Body mass index (BMI) is not a perfect measure to assess the health risks of diet and body composition.
One of its limitations is that it treats all body mass – including fat, muscle, organs, and bone structure – as equally risky for health.
However, we know that it is fat adipose tissue, and in particular, visceral fat that is most strongly associated with poor health outcomes.1 Visceral fat is fat stored in the abdomen around the internal organs. This is differentiated from subcutaneous fat which sits just under the skin, and is distributed across the body. Subcutaneous fat is much more visible than visceral fat, which is often hidden.
This means that an individual might be at lower risk of negative health outcomes if their elevated weight is the result of other factors besides visceral fat. For example, an athlete may have high amounts of muscle tissue. Or, someone may have more subcutaneous fat, which has lower associations with health risks.
In fact, women tend to have more subcutaneous fat, and men more visceral fat. As a result, men are typically at a higher risk of non-communicable diseases: this is one of the reasons that women tend to live longer than men.
A better measure of health risks is therefore levels of visceral fat. The problem with this metric is that it requires internal imaging, such as abdominal computed tomography (CT). This is expensive, and not scalable to assess health at the population level.
One metric which might give a better proxy for health risks than BMI is waist circumference or waist-to-hip ratio.2 This is because it gives a more direct measure of abdominal fat. This measure is being used more frequently in public health.
Nonetheless, BMI is still the primary indicator used globally to assess the health risks associated with diet and body composition. While it may be inappropriate for some individuals (listed below), at a population level it provides a strong indicator of health risks associated with obesity.
It should also be noted that the ‘optimal’ healthy weight is not the same for everyone. For this reason, the defined ‘healthy BMI’ is given as a significant range to account for individual variability.
BMI may not be appropriate for assessment in:
- Pregnant women
- Athletes, or people with large amounts of muscle mass
- Particular ethnicities – in particular, those of Asian origin. This is because those of Asian origin tend to store more visceral fat around the abdomen, as opposed to storing it subcutaneously, just under the skin. This means they are at higher risk of negative health outcomes at a lower BMI. While the WHO maintains consistent BMI thresholds internationally, it suggests that for those of Asian origin, elevated risk might be as low as a BMI of 22 kg/m2 – significantly lower than the international threshold of 25 kg/m2 for being overweight.3
Endnotes
Swainson, M. G., Batterham, A. M., Tsakirides, C., Rutherford, Z. H., & Hind, K. (2017). Prediction of whole-body fat percentage and visceral adipose tissue mass from five anthropometric variables. PloS one, 12(5), e0177175.
Kuk, J. L., Katzmarzyk, P. T., Nichaman, M. Z., Church, T. S., Blair, S. N., & Ross, R. (2006). Visceral fat is an independent predictor of all-cause mortality in men. Obesity, 14(2), 336-341.
Koster, A., Murphy, R. A., Eiriksdottir, G., Aspelund, T., Sigurdsson, S., Lang, T. F., ... & Harris, T. B. (2015). Fat distribution and mortality: the AGES, Reykjavik Study. Obesity, 23(4), 893-897.
Swainson, M. G., Batterham, A. M., Tsakirides, C., Rutherford, Z. H., & Hind, K. (2017). Prediction of whole-body fat percentage and visceral adipose tissue mass from five anthropometric variables. PloS one, 12(5), e0177175.
Consultation, W. E. (2004). Appropriate body-mass index for Asian populations and its implications for policy and intervention strategies. Lancet, 363(9403), 157-163.
Cite this work
Our articles and data visualizations rely on work from many different people and organizations. When citing this article, please also cite the underlying data sources. This article can be cited as:
Hannah Ritchie (2022) - “What is obesity and how is it measured?” Published online at OurWorldinData.org. Retrieved from: 'https://archive.ourworldindata.org/20260630-140245/obesity-definition.html' [Online Resource] (archived on June 30, 2026).BibTeX citation
@article{owid-obesity-definition,
    author = {Hannah Ritchie},
    title = {What is obesity and how is it measured?},
    journal = {Our World in Data},
    year = {2022},
    note = {https://archive.ourworldindata.org/20260630-140245/obesity-definition.html}
}
Reuse this work freely
All visualizations, data, and articles produced by Our World in Data are completely open access under the Creative Commons BY license. You have the permission to use, distribute, and reproduce these in any medium, provided the source and authors are credited.
The data produced by third parties and made available by Our World in Data is subject to the license terms from the original third-party authors. We will always indicate the original source of the data in our documentation, so you should always check the license of any such third-party data before use and redistribution.
All of our charts can be embedded in any site.