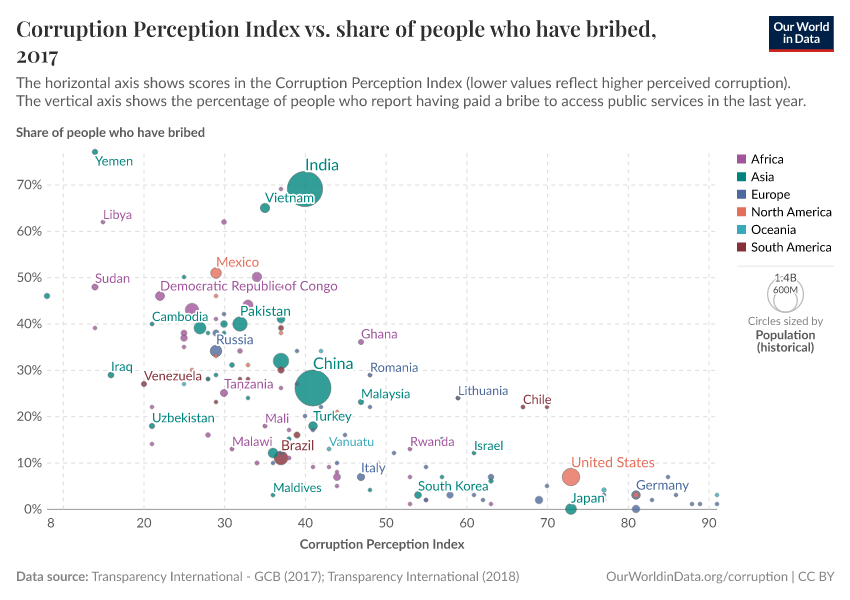
Corruption Perception Index vs. share of people who have bribed, 2017
The horizontal axis shows scores in the Corruption Perception Index (lower values reflect higher perceivedcorruption). The vertical axis shows the percentage of people who report having paid a bribe to access publicservices in the last year.
Select countries and regions
Sort by
Name
All countries and regions

Interactive visualization requires JavaScript
Related research and data
Charts
- Average rating of perceived corruption in public sector
- Bribe payers index
- Bribery incidence for firms
- Bribery prevalence
- Bribery rates
- Corruption Perception Index
- Human Development Index vs. Corruption Perception Index
- Incidence of bribe requests, private sector
- Learning-adjusted years of schooling vs. Corruption Perception Index
- Perception of corruption by institution
- Political corruption index
- Share of people who think political parties are very corrupt
- Unpaid parking violations per diplomat in New York City by country of origin