Share of people who are undernourished
What you should know about this indicator
- Hunger has been a severe problem throughout history. For most people, growing enough food to feed their family was a daily struggle. Food shortages, malnutrition, and famines were common around the world.
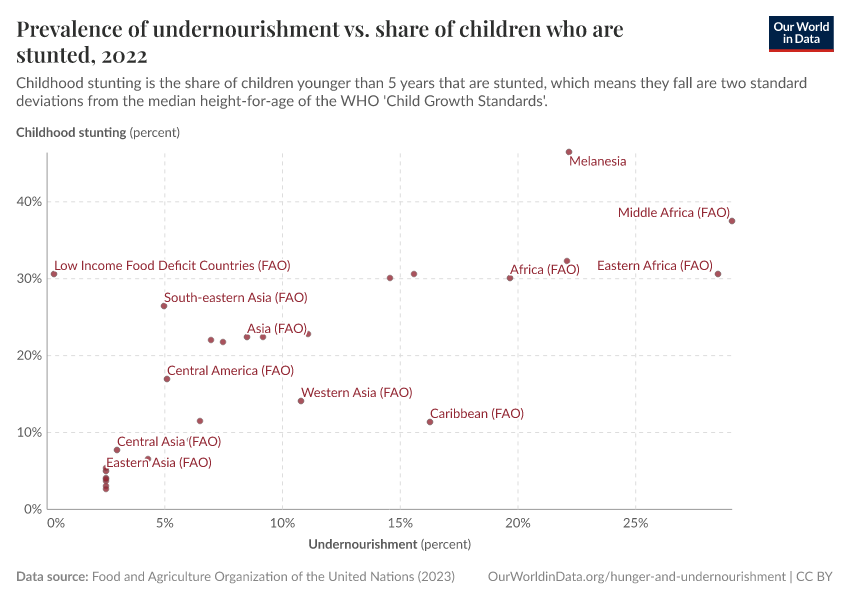
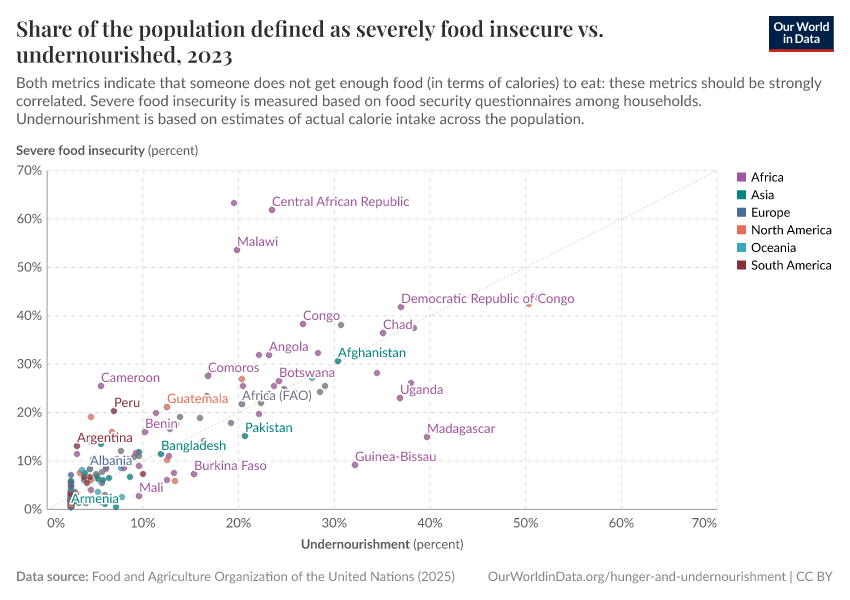
- This data estimates the share of people who are undernourished — those whose daily energy (calorie) intake is too low to support a normal, active, and healthy life.
- Undernourishment is determined solely by whether a person gets enough calories. It does not account for the quality or diversity of their diet. Therefore, it is only one aspect of malnutrition, a broader term that captures other deficiencies, such as micronutrients.
- Minimum calorie needs vary by sex, age, body size, and activity level. Researchers use demographic data to account for these differences in each country's estimates.
- The data is published by the Food and Agriculture Organization of the United Nations (FAO). It is based on a statistical model that combines national food supply data, demographic projections, and, where available, household food consumption surveys. To reduce short-term variability on country-level data, the FAO sets the values for a given year to the average of the last three years.
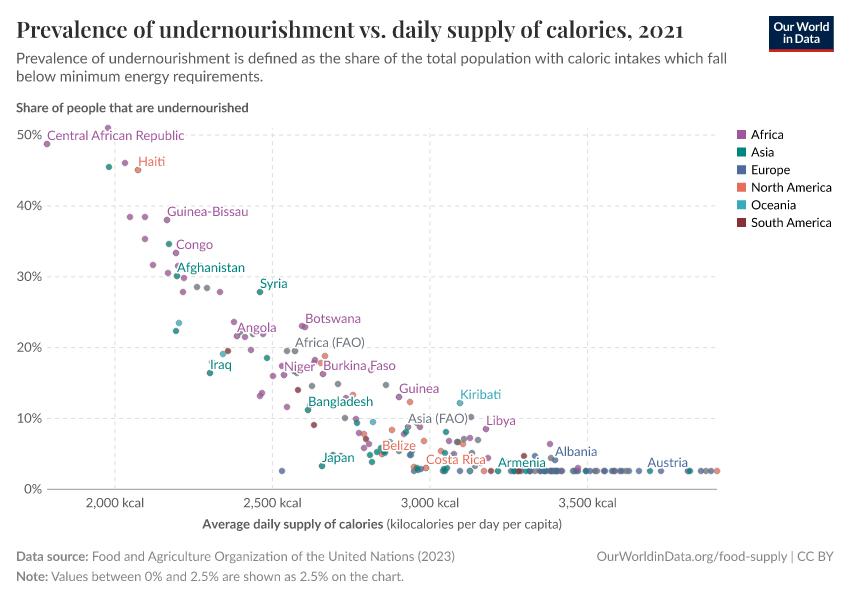
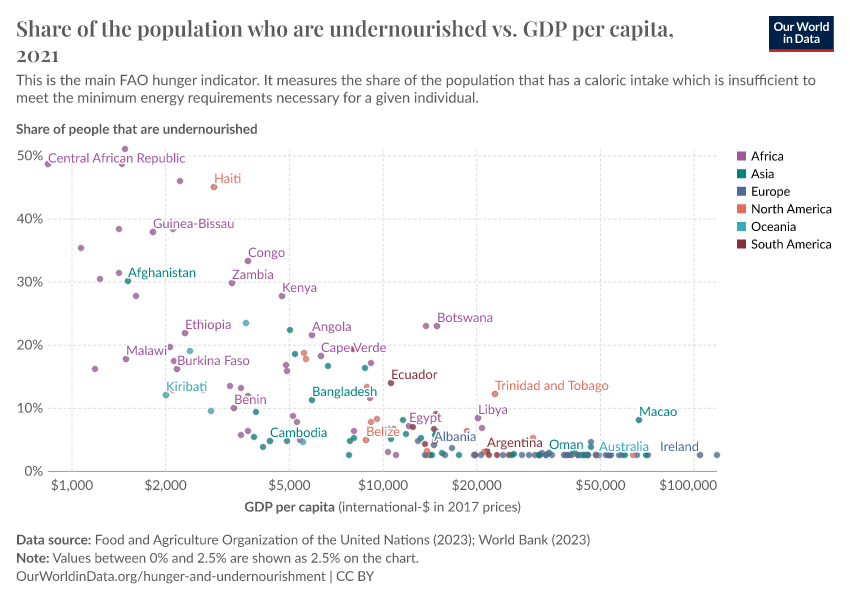
- Many countries, especially high-income ones, are shown at 2.5% because the FAO reports values between 0% and 2.5% as "<2.5%", due to uncertainty at very low levels of undernourishment.
- The world has made significant progress in reducing undernourishment. However, this data shows we are still far from ending hunger: nearly 1 in 10 people globally don't get enough to eat. Hunger worsened during the COVID-19 pandemic and remains a major challenge.
Related research and writing
What you should know about this indicator
- Hunger has been a severe problem throughout history. For most people, growing enough food to feed their family was a daily struggle. Food shortages, malnutrition, and famines were common around the world.
- This data estimates the share of people who are undernourished — those whose daily energy (calorie) intake is too low to support a normal, active, and healthy life.
- Undernourishment is determined solely by whether a person gets enough calories. It does not account for the quality or diversity of their diet. Therefore, it is only one aspect of malnutrition, a broader term that captures other deficiencies, such as micronutrients.
- Minimum calorie needs vary by sex, age, body size, and activity level. Researchers use demographic data to account for these differences in each country's estimates.
- The data is published by the Food and Agriculture Organization of the United Nations (FAO). It is based on a statistical model that combines national food supply data, demographic projections, and, where available, household food consumption surveys. To reduce short-term variability on country-level data, the FAO sets the values for a given year to the average of the last three years.
- Many countries, especially high-income ones, are shown at 2.5% because the FAO reports values between 0% and 2.5% as "<2.5%", due to uncertainty at very low levels of undernourishment.
- The world has made significant progress in reducing undernourishment. However, this data shows we are still far from ending hunger: nearly 1 in 10 people globally don't get enough to eat. Hunger worsened during the COVID-19 pandemic and remains a major challenge.
Sources and processing
This data is based on the following sources
How we process data at Our World in Data
All data and visualizations on Our World in Data rely on data sourced from one or several original data providers. Preparing this original data involves several processing steps. Depending on the data, this can include standardizing country names and world region definitions, converting units, calculating derived indicators such as per capita measures, as well as adding or adapting metadata such as the name or the description given to an indicator.
At the link below you can find a detailed description of the structure of our data pipeline, including links to all the code used to prepare data across Our World in Data.
Reuse this work
- All data produced by third-party providers and made available by Our World in Data are subject to the license terms from the original providers. Our work would not be possible without the data providers we rely on, so we ask you to always cite them appropriately (see below). This is crucial to allow data providers to continue doing their work, enhancing, maintaining and updating valuable data.
- All data, visualizations, and code produced by Our World in Data are completely open access under the Creative Commons BY license. You have the permission to use, distribute, and reproduce these in any medium, provided the source and authors are credited.
Citations
How to cite this page
To cite this page overall, including any descriptions, FAQs or explanations of the data authored by Our World in Data, please use the following citation:
“Data Page: Share of people who are undernourished”, part of the following publication: Hannah Ritchie, Pablo Rosado, and Max Roser (2023) - “Agricultural Production”. Data adapted from Food and Agriculture Organization of the United Nations. Retrieved from https://archive.ourworldindata.org/20250909-093708/grapher/prevalence-of-undernourishment.html [online resource] (archived on September 9, 2025).How to cite this data
In-line citationIf you have limited space (e.g. in data visualizations), you can use this abbreviated in-line citation:
Food and Agriculture Organization of the United Nations (2025) – with major processing by Our World in DataFull citation
Food and Agriculture Organization of the United Nations (2025) – with major processing by Our World in Data. “Share of people who are undernourished – UN FAO” [dataset]. Food and Agriculture Organization of the United Nations, “SDG Indicators” [original data]. Retrieved December 19, 2025 from https://archive.ourworldindata.org/20250909-093708/grapher/prevalence-of-undernourishment.html (archived on September 9, 2025).