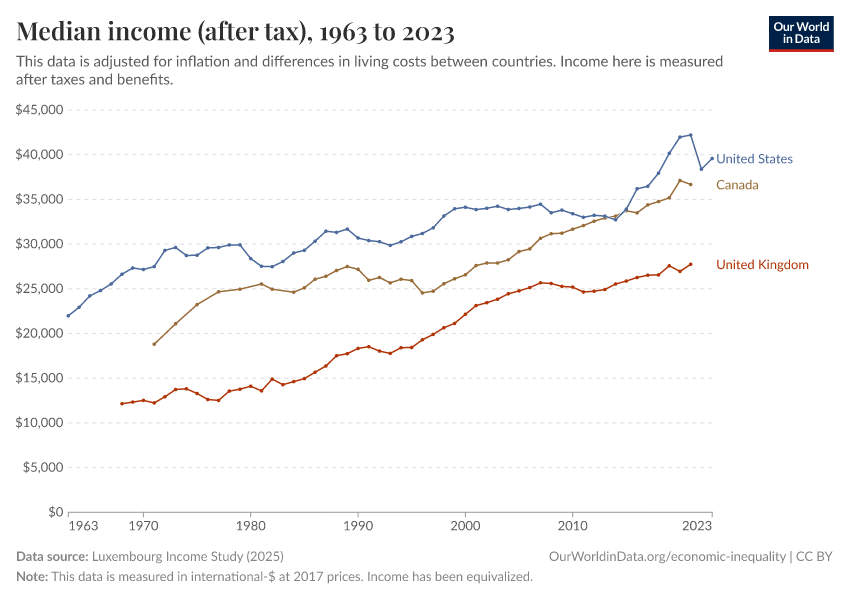
Median income per year (after tax)

What you should know about this indicator
- This data is expressed in constant international dollars to adjust for inflation and differences in living costs between countries. Read more in our article, What are international dollars?
- Income is post-tax — measured after taxes have been paid and most government benefits have been received.
- Income has been equivalized – adjusted to account for the fact that people in the same household can share costs like rent and heating.
Sources and processing
This data is based on the following sources
How we process data at Our World in Data
All data and visualizations on Our World in Data rely on data sourced from one or several original data providers. Preparing this original data involves several processing steps. Depending on the data, this can include standardizing country names and world region definitions, converting units, calculating derived indicators such as per capita measures, as well as adding or adapting metadata such as the name or the description given to an indicator.
At the link below you can find a detailed description of the structure of our data pipeline, including links to all the code used to prepare data across Our World in Data.
Reuse this work
- All data produced by third-party providers and made available by Our World in Data are subject to the license terms from the original providers. Our work would not be possible without the data providers we rely on, so we ask you to always cite them appropriately (see below). This is crucial to allow data providers to continue doing their work, enhancing, maintaining and updating valuable data.
- All data, visualizations, and code produced by Our World in Data are completely open access under the Creative Commons BY license. You have the permission to use, distribute, and reproduce these in any medium, provided the source and authors are credited.
Citations
How to cite this page
To cite this page overall, including any descriptions, FAQs or explanations of the data authored by Our World in Data, please use the following citation:
“Data Page: Median income per year (after tax)”, part of the following publication: Joe Hasell, Bertha Rohenkohl, Pablo Arriagada, Esteban Ortiz-Ospina, and Max Roser (2022) - “Poverty”. Data adapted from Luxembourg Income Study. Retrieved from https://archive.ourworldindata.org/20251224-105916/grapher/median-income-after-tax-lis.html [online resource] (archived on December 24, 2025).How to cite this data
In-line citationIf you have limited space (e.g. in data visualizations), you can use this abbreviated in-line citation:
Luxembourg Income Study (2025) – with minor processing by Our World in DataFull citation
Luxembourg Income Study (2025) – with minor processing by Our World in Data. “Median income per year (after tax)” [dataset]. Luxembourg Income Study, “Luxembourg Income Study (LIS)” [original data]. Retrieved January 16, 2026 from https://archive.ourworldindata.org/20251224-105916/grapher/median-income-after-tax-lis.html (archived on December 24, 2025).