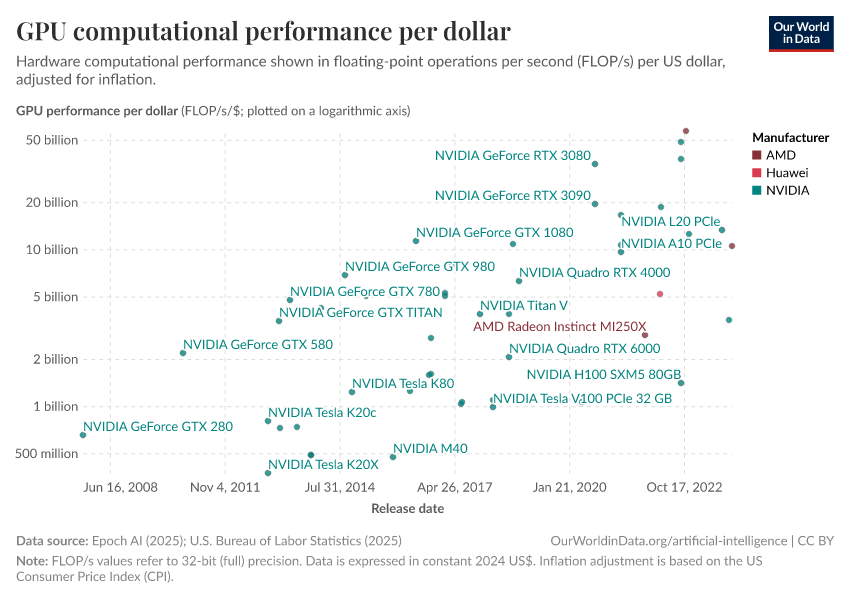
GPU computational performance per dollar

What you should know about this indicator
- This measures computing power per dollar—specifically, how many calculations per second you get for each inflation-adjusted dollar when buying a GPU.
- GPUs are specialized chips that can perform many calculations simultaneously, making them the primary hardware for training AI systems. The data includes only GPUs used to train major AI models (those with over 1 billion parameters) or specifically designed for machine learning.
- The chart shows theoretical peak performance using a standard precision format (32-bit precision). Modern AI training typically uses lower precision calculations that are faster, so real-world performance may be higher than shown here.
- These figures reflect purchase prices only (adjusted to 2024 dollars). Running costs—electricity, cooling, and infrastructure—are not included here.
- Raw hardware improvements tell only part of the story. Software and algorithmic advances often deliver substantial speedups, independent of better hardware.
Sources and processing
This data is based on the following sources
How we process data at Our World in Data
All data and visualizations on Our World in Data rely on data sourced from one or several original data providers. Preparing this original data involves several processing steps. Depending on the data, this can include standardizing country names and world region definitions, converting units, calculating derived indicators such as per capita measures, as well as adding or adapting metadata such as the name or the description given to an indicator.
At the link below you can find a detailed description of the structure of our data pipeline, including links to all the code used to prepare data across Our World in Data.
Notes on our processing step for this indicator
- Reporting a time series of AI investments in nominal prices (i.e., without adjusting for inflation) means it makes little sense to compare observations across time; it is therefore not very useful. To make comparisons across time possible, one has to take into account that prices change (e.g., there is inflation).
- It is not obvious how to adjust this time series for inflation, and we debated it at some length within our team.
- It would be straightforward to adjust the time series for price changes if we knew the prices of the specific goods and services that these investments purchased. This would make it possible to calculate a volume measure of AI investments, and it would tell us how much these investments bought. But such a metric is not available. While a comprehensive price index is not available, we know that the cost for some crucial AI technology has fallen rapidly in price.
- In the absence of a comprehensive price index that captures the price of AI-specific goods and services, one has to rely on one of the available metrics for the price of a bundle of goods and services. In the end we decided to use the US Consumer Price Index (CPI).
- The US CPI does not provide us with a volume measure of AI goods and services, but it does capture the opportunity costs of these investments. The inflation adjustment of this time series of AI investments therefore lets us understand the size of these investments relative to whatever else these sums of money could have purchased.
Reuse this work
- All data produced by third-party providers and made available by Our World in Data are subject to the license terms from the original providers. Our work would not be possible without the data providers we rely on, so we ask you to always cite them appropriately (see below). This is crucial to allow data providers to continue doing their work, enhancing, maintaining and updating valuable data.
- All data, visualizations, and code produced by Our World in Data are completely open access under the Creative Commons BY license. You have the permission to use, distribute, and reproduce these in any medium, provided the source and authors are credited.
Citations
How to cite this page
To cite this page overall, including any descriptions, FAQs or explanations of the data authored by Our World in Data, please use the following citation:
“Data Page: GPU computational performance per dollar”, part of the following publication: Charlie Giattino, Edouard Mathieu, Veronika Samborska, and Max Roser (2023) - “Artificial Intelligence”. Data adapted from Epoch AI, U.S. Bureau of Labor Statistics. Retrieved from https://archive.ourworldindata.org/20251110-143417/grapher/gpu-price-performance.html [online resource] (archived on November 10, 2025).How to cite this data
In-line citationIf you have limited space (e.g. in data visualizations), you can use this abbreviated in-line citation:
Epoch AI (2025); U.S. Bureau of Labor Statistics (2025) – with major processing by Our World in DataFull citation
Epoch AI (2025); U.S. Bureau of Labor Statistics (2025) – with major processing by Our World in Data. “GPU computational performance per dollar” [dataset]. Epoch AI, “Machine Learning Hardware”; U.S. Bureau of Labor Statistics, “US consumer prices” [original data]. Retrieved December 14, 2025 from https://archive.ourworldindata.org/20251110-143417/grapher/gpu-price-performance.html (archived on November 10, 2025).