
Literacy rate
What you should know about this indicator
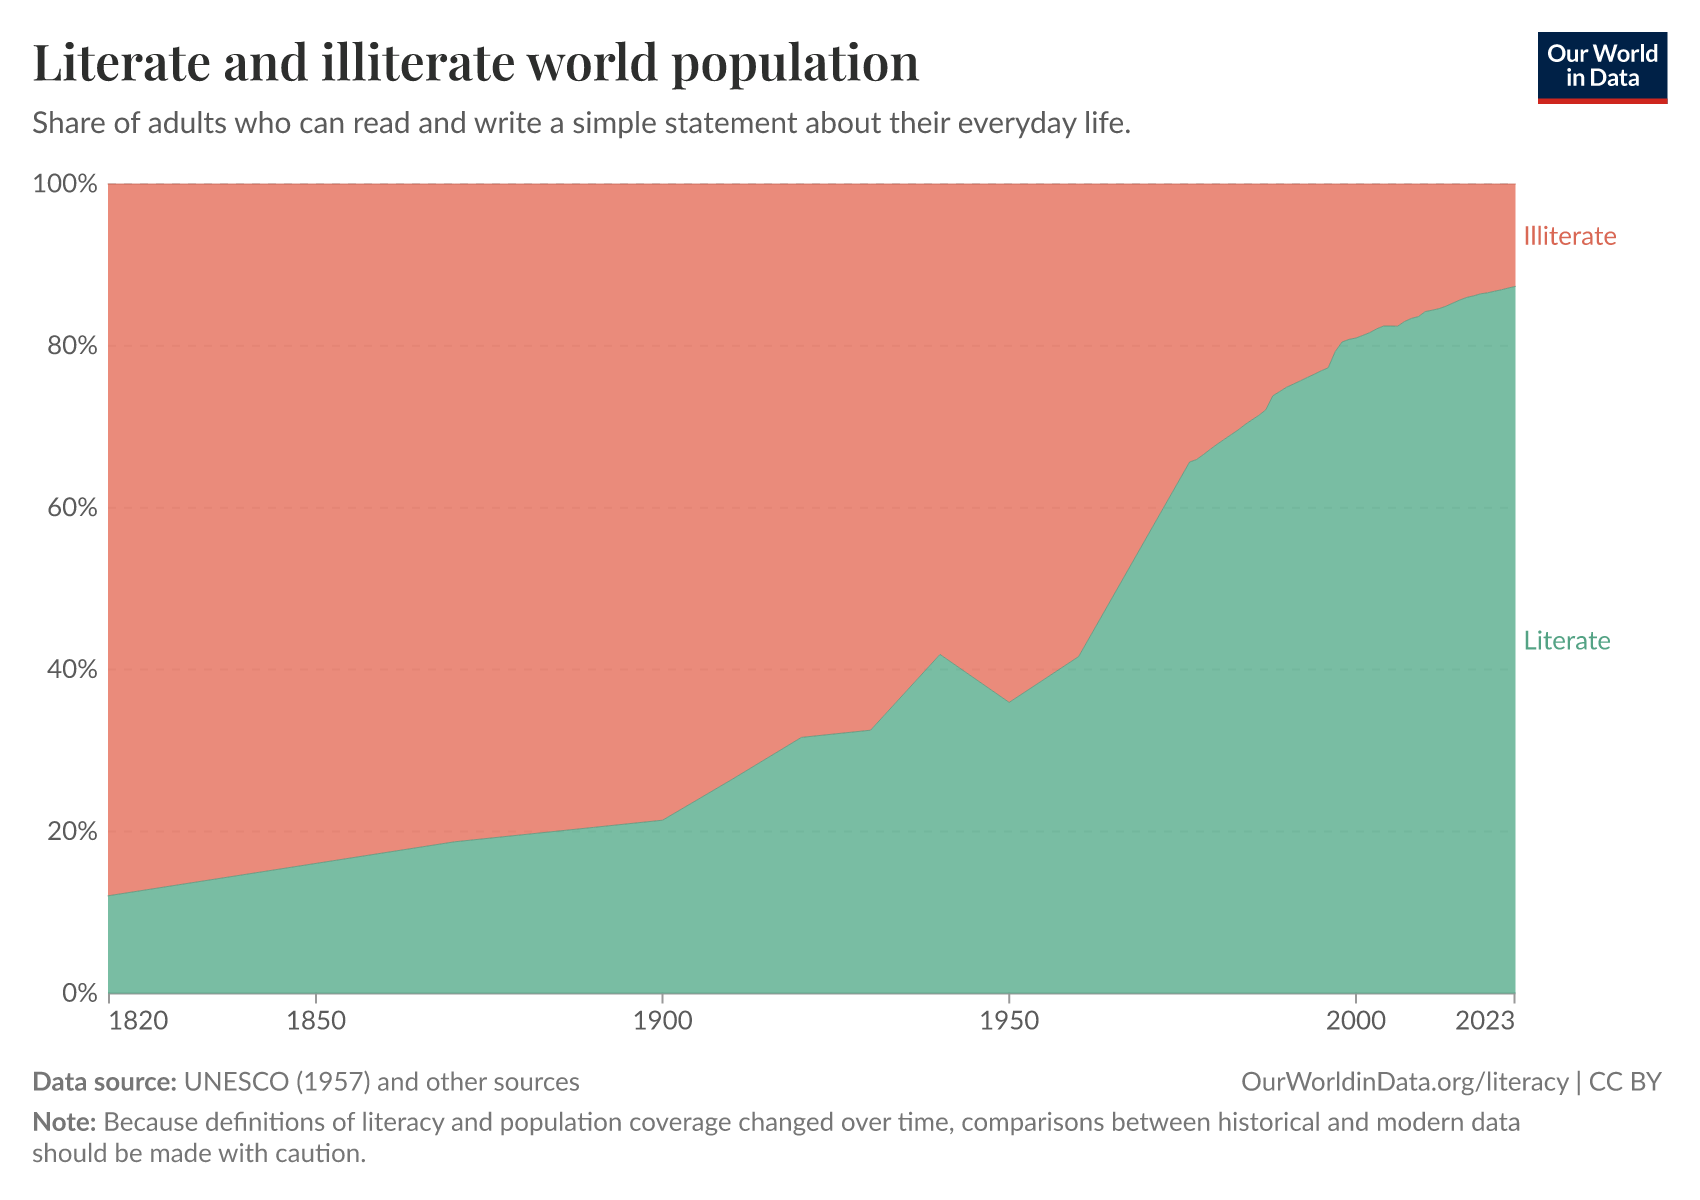
- Literacy is a foundational skill. Children need to learn to read so that they can read to learn. When we fail to teach this foundational skill, people have fewer opportunities to lead the rich and interesting lives that a good education offers. This indicator measures the percentage of people aged 15 and older who can read and write a simple sentence about their daily life.
- Historical data shows that only a very small share of the population, a tiny elite, was able to read and write. Although literacy has increased over the last few generations, it remains an important challenge for our time to provide this foundational skill to all.
- However, measuring literacy over time is difficult, as definitions of what it means to be “literate” have varied widely across countries and historical periods. As a result, comparisons should be made with caution.
- Our team investigated the strengths and shortcomings of the available data on literacy. Based on this work, we've combined historical and contemporary literacy rates from various sources to provide a long-term view of global literacy trends from 1451 to the present. For detailed information on where each data point comes from, you can view and download this Google Sheet.
- Many developed countries have discontinued literacy tracking as rates approached universal levels by the late 20th century, making measurement less relevant for policy purposes.
- All of this data measures basic literacy — can you read simple text and write your name? It doesn't capture functional literacy — can you understand a job application or follow written instructions? That requires years more education and is much harder to measure historically.
Related research and writing
Explore charts that include this data

What you should know about this indicator
- Literacy is a foundational skill. Children need to learn to read so that they can read to learn. When we fail to teach this foundational skill, people have fewer opportunities to lead the rich and interesting lives that a good education offers. This indicator measures the percentage of people aged 15 and older who can read and write a simple sentence about their daily life.
- Historical data shows that only a very small share of the population, a tiny elite, was able to read and write. Although literacy has increased over the last few generations, it remains an important challenge for our time to provide this foundational skill to all.
- However, measuring literacy over time is difficult, as definitions of what it means to be “literate” have varied widely across countries and historical periods. As a result, comparisons should be made with caution.
- Our team investigated the strengths and shortcomings of the available data on literacy. Based on this work, we've combined historical and contemporary literacy rates from various sources to provide a long-term view of global literacy trends from 1451 to the present. For detailed information on where each data point comes from, you can view and download this Google Sheet.
- Many developed countries have discontinued literacy tracking as rates approached universal levels by the late 20th century, making measurement less relevant for policy purposes.
- All of this data measures basic literacy — can you read simple text and write your name? It doesn't capture functional literacy — can you understand a job application or follow written instructions? That requires years more education and is much harder to measure historically.
Sources and processing
This data is based on the following sources
How we process data at Our World in Data
All data and visualizations on Our World in Data rely on data sourced from one or several original data providers. Preparing this original data involves several processing steps. Depending on the data, this can include standardizing country names and world region definitions, converting units, calculating derived indicators such as per capita measures, as well as adding or adapting metadata such as the name or the description given to an indicator.
At the link below you can find a detailed description of the structure of our data pipeline, including links to all the code used to prepare data across Our World in Data.
Notes on our processing step for this indicator
- This dataset combines historical and contemporary literacy rates from various sources to provide a long-term view of global literacy trends from 1451 to the present.
- 1451–1800: Direct literacy surveys did not exist during this period. Data for Great Britain, Ireland, France, Belgium, the Netherlands, Germany, Italy, Spain, Sweden, and Poland comes from the "Charting the Rise of the West" study. The authors estimated literacy rates using manuscript and book production as indirect indicators. While more books likely indicated more readers, this approach has clear limitations.
- 1820–1970 (Global estimates): Estimates for worldwide literacy are drawn from the OECD's “How Was Life? Global Wellbeing Since 1820” report, which compiled a global long-run estimate of literacy using available historical records. A key limitation is that early literacy measures often accepted minimal skills — such as the ability to sign marriage documents — which fall short of contemporary literacy standards involving actual reading and writing proficiency.
- 1900–1950: UNESCO's “Progress of literacy in various countries” gathered data from 26 countries, revealing substantial variation in definitions. Some countries required only reading or writing skills, others demanded both, and some accepted signature ability as sufficient proof. Age thresholds also varied widely, ranging from 5 to 15 years.
- 1950: UNESCO's “World Illiteracy at Mid-Century” marked a significant milestone as the first comprehensive global literacy assessment. Data primarily came from censuses conducted between 1945 and 1954 for populations aged 15 and older. Where census data was unavailable, researchers generated estimates using historical trends and country-specific factors. Given the uncertainty, literacy rates were reported in 5% intervals. This data is reported as a range (e.g., 10–20%). These ranges were converted into single-point estimates by taking their midpoint to allow for consistent analysis. For example, 10–20% was recoded as 15%.
- 1970–present: Contemporary data comes from the UNESCO Institute for Statistics, based on population censuses or household surveys, and is often self-reported. A person is considered literate if they can read and write a short, simple sentence about everyday life. Many countries also include basic numeracy in this definition. Rates are shown as the percentage of the population aged 15 and above who meet this threshold.
- When only the illiteracy rate was reported, the literacy rate was calculated by subtracting it from 100%.
Reuse this work
- All data produced by third-party providers and made available by Our World in Data are subject to the license terms from the original providers. Our work would not be possible without the data providers we rely on, so we ask you to always cite them appropriately (see below). This is crucial to allow data providers to continue doing their work, enhancing, maintaining and updating valuable data.
- All data, visualizations, and code produced by Our World in Data are completely open access under the Creative Commons BY license. You have the permission to use, distribute, and reproduce these in any medium, provided the source and authors are credited.
Citations
How to cite this page
To cite this page overall, including any descriptions, FAQs or explanations of the data authored by Our World in Data, please use the following citation:
“Data Page: Literacy rate”, part of the following publication: Hannah Ritchie, Veronika Samborska, Esteban Ortiz-Ospina, and Max Roser (2023) - “Global Education”. Data adapted from UNESCO, Buringh and van Zanden, van Zanden, J. et al., UNESCO Institute for Statistics. Retrieved from https://archive.ourworldindata.org/20251210-172555/grapher/cross-country-literacy-rates.html [online resource] (archived on December 10, 2025).How to cite this data
In-line citationIf you have limited space (e.g. in data visualizations), you can use this abbreviated in-line citation:
UNESCO (1957) and other sources – with major processing by Our World in DataFull citation
UNESCO (1957); UNESCO (1953); Buringh and van Zanden (2009); van Zanden, J. et al.; UNESCO Institute for Statistics (2025) – with major processing by Our World in Data. “Literacy rate” [dataset]. UNESCO, “World illiteracy at mid-century”; UNESCO, “Progress of literacy in various countries”; Buringh and van Zanden, “Charting the “Rise of the West”: Manuscripts and Printed Books in Europe, A Long-Term Perspective from the Sixth through Eighteenth Centuries”; van Zanden, J. et al., “How Was Life? Global Well-being since 1820 - Education 2014”; UNESCO Institute for Statistics, “UNESCO Institute for Statistics (UIS) - Education” [original data]. Retrieved January 14, 2026 from https://archive.ourworldindata.org/20251210-172555/grapher/cross-country-literacy-rates.html (archived on December 10, 2025).