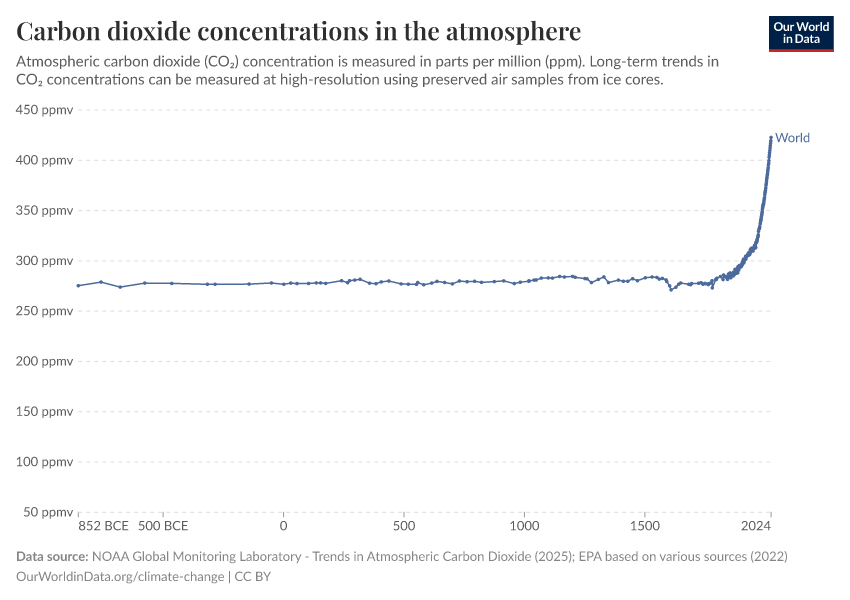
Annual concentration of atmospheric carbon dioxide

What you should know about this indicator
Based on ice core studies of historical concentration of greenhouse gases, and recent air monitoring sites around the world.
What you should know about this indicator
Based on ice core studies of historical concentration of greenhouse gases, and recent air monitoring sites around the world.
Sources and processing
This data is based on the following sources
How we process data at Our World in Data
All data and visualizations on Our World in Data rely on data sourced from one or several original data providers. Preparing this original data involves several processing steps. Depending on the data, this can include standardizing country names and world region definitions, converting units, calculating derived indicators such as per capita measures, as well as adding or adapting metadata such as the name or the description given to an indicator.
At the link below you can find a detailed description of the structure of our data pipeline, including links to all the code used to prepare data across Our World in Data.
Reuse this work
- All data produced by third-party providers and made available by Our World in Data are subject to the license terms from the original providers. Our work would not be possible without the data providers we rely on, so we ask you to always cite them appropriately (see below). This is crucial to allow data providers to continue doing their work, enhancing, maintaining and updating valuable data.
- All data, visualizations, and code produced by Our World in Data are completely open access under the Creative Commons BY license. You have the permission to use, distribute, and reproduce these in any medium, provided the source and authors are credited.
Citations
How to cite this page
To cite this page overall, including any descriptions, FAQs or explanations of the data authored by Our World in Data, please use the following citation:
“Data Page: Annual concentration of atmospheric carbon dioxide”, part of the following publication: Hannah Ritchie, Pablo Rosado, and Veronika Samborska (2024) - “Climate Change”. Data adapted from NOAA Global Monitoring Laboratory, United States Environmental Protection Agency. Retrieved from https://archive.ourworldindata.org/20260119-120254/grapher/co2-long-term-concentration.html [online resource] (archived on January 19, 2026).How to cite this data
In-line citationIf you have limited space (e.g. in data visualizations), you can use this abbreviated in-line citation:
NOAA Global Monitoring Laboratory - Trends in Atmospheric Carbon Dioxide (2026); EPA based on various sources (2022) – with major processing by Our World in DataFull citation
NOAA Global Monitoring Laboratory - Trends in Atmospheric Carbon Dioxide (2026); EPA based on various sources (2022) – with major processing by Our World in Data. “Annual concentration of atmospheric carbon dioxide” [dataset]. NOAA Global Monitoring Laboratory, “Trends in Atmospheric Carbon Dioxide”; United States Environmental Protection Agency, “Climate Change Indicators: Atmospheric Concentrations of Greenhouse Gases” [original data]. Retrieved February 14, 2026 from https://archive.ourworldindata.org/20260119-120254/grapher/co2-long-term-concentration.html (archived on January 19, 2026).