Employment in agriculture: data sources and definitions
How do we produce long-term datasets on agricultural employment?
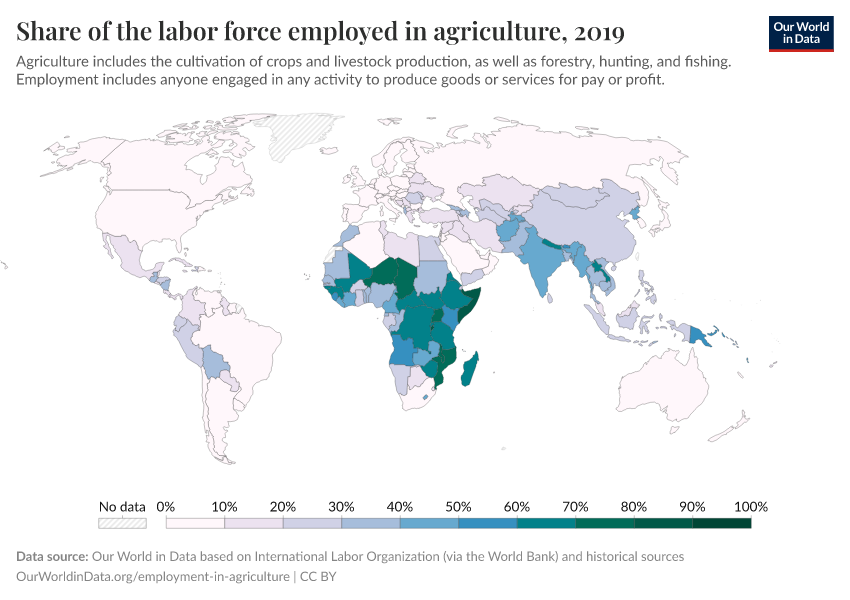
Agricultural employment is an important metric used in development. As countries develop and incomes rise, the share of the labor force working in agriculture tends to decline as farming systems become more productive, and people move to other sectors such as industry and services.
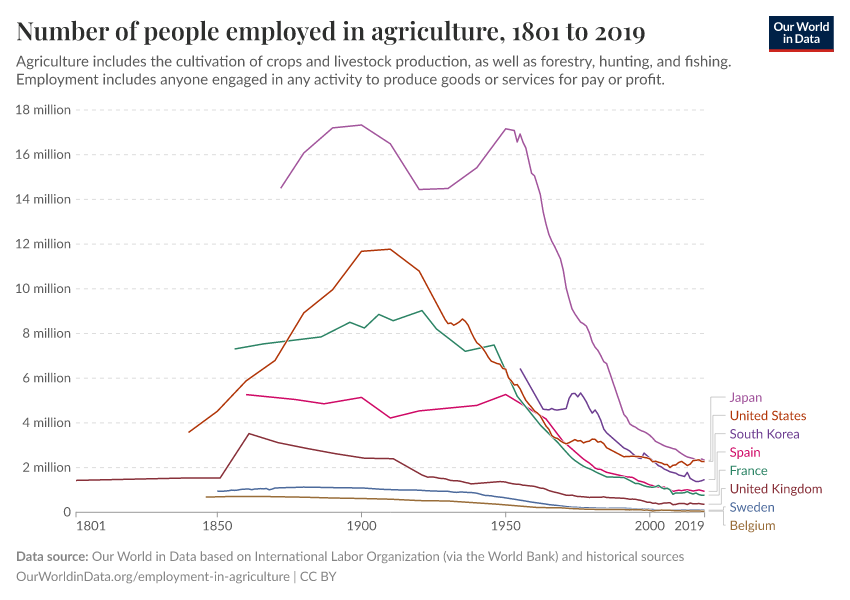
At Our World in Data we have constructed a long-term series of agricultural employment, combining recent data for every country in the world with historical series for select countries where this data is available.
Here I detail the sources we use to construct this dataset.
The script that produces this long-run dataset can be accessed in our GitHub repository.
We provide a full citation for each of the sources below. If you cite data for a specific period, please cite the original source. For example, for the period 1991 onwards, please cite the International Labor Organization. You can add “via Our World in Data” if you downloaded the data from us.

Employment in agriculture: Our data sources
Pre-1800: Broadberry and Gardner (2013)
The share of the labor force employed in agriculture prior to 1800 is available for a select number of countries.
This data is sourced from the work of Stephen Broadberry and Leigh Gardner (2013), who compile these estimates for different countries from multiple countries. This series contains long-run data for England; in our dataset we have adopted these figures for the United Kingdom as a whole.
Full citation: Stephen Broadberry and Leigh Gardner (2013). Africa’s Growth Prospects in a European Mirror: A Historical Perspective. Online here.
The underlying sources of this data by country are as follows:
- Broadberry, S. N., Campbell, B. M. S., & van Leeuwen, B. (2013), “When Did Britain Industrialise? The Sectoral Distribution of the Labour Force and Labour Productivity in Britain, 1381-1851,” Explorations in Economic History, 50(1), 16–27. Online here.
- Allen, R.C. (2000), “Economic Structure and Agricultural Productivity in Europe, 1300-1800,” European Review of Economic History, 4, 1-26. Online here.
1801 to 1985: Herrendorf et al. (2014)
Data on the number of people employed in agriculture is available for some countries, extending back to 1801.
This data is sourced from the work of Berthold Herrendorf, Richard Rogerson and Ákos Valentinyi (2014).
To preserve a consistent series between Herrendorf et al. (2014) data and the ILO series from 1991 onwards (detailed below), data points from 1986 to 1990 have not been included.
Full citation: Berthold Herrendorf, Richard Rogerson and Akos Valentinyi (2014) – “Growth and Structural Transformation” Handbook of Economic Growth Vol. 2B.
The authors compile this data from multiple sources, listed below:
1991 onwards: International Labor Organization
The data for all countries from the year 1991 onwards is sourced from the International Labor Organization (ILO).
This data is made available through the World Bank's World Development Indicators.
The ILO publishes statistics on the share of the labor force that is employed in agriculture [it also provides the share working in industry, and services as separate metrics]. You can find its database here.
Full citation: International Labor Organization (ILO)
Derived metric: Number of people working in agriculture
The ILO publishes data on the share of the labor force working in agriculture.
Our World in Data has also calculated the number of people working in agriculture. You can find this chart here.
We had done so based on two metrics published by the ILO via the World Bank:
- Total number of people in the labor force
- Share of the labor force working in agriculture
We then calculate the number working in agriculture as:
Number working in agriculture = Total number of people in the labor force * Share of labor force working in agriculture
How is agricultural employment defined?
Employment of any type is quantified as the number of working-age people engaged in any activity to produce goods or provide services for pay or profit. This includes those actively working; on temporary job absences, or in another working-time arrangement. Labor from people not of working age – such as child labor – is not included.
In agriculture, this includes employees of agricultural activities and subsistence farmers who produce goods for themselves rather than for the market.
Agriculture in this case includes activities in agriculture (such as crop farming or livestock raising), hunting, forestry, and fishing.
Keep reading at Our World in Data
Cite this work
Our articles and data visualizations rely on work from many different people and organizations. When citing this article, please also cite the underlying data sources. This article can be cited as:
Hannah Ritchie (2022) - “Employment in agriculture: data sources and definitions” Published online at OurWorldinData.org. Retrieved from: 'https://archive.ourworldindata.org/20251125-173858/agri-employment-sources.html' [Online Resource] (archived on November 25, 2025).BibTeX citation
@article{owid-agri-employment-sources,
    author = {Hannah Ritchie},
    title = {Employment in agriculture: data sources and definitions},
    journal = {Our World in Data},
    year = {2022},
    note = {https://archive.ourworldindata.org/20251125-173858/agri-employment-sources.html}
}
Reuse this work freely
All visualizations, data, and code produced by Our World in Data are completely open access under the Creative Commons BY license. You have the permission to use, distribute, and reproduce these in any medium, provided the source and authors are credited.
The data produced by third parties and made available by Our World in Data is subject to the license terms from the original third-party authors. We will always indicate the original source of the data in our documentation, so you should always check the license of any such third-party data before use and redistribution.
All of our charts can be embedded in any site.

