Sustainable Development Goal 12
Ensure sustainable consumption and production patterns
Sustainable Development Goal 12 is to “ensure sustainable consumption and production patterns”, according to the United Nations.
The visualizations and data below present the global perspective on where the world stands today and how it has changed over time.
The UN has defined 11 targets and 13 indicators for SDG 12. Targets specify the goals and indicators represent the metrics by which the world aims to track whether these targets are achieved. Below we quote the original text of all targets and show the data on the agreed indicators.
List of targets and indicators
Target 12.1Implement the 10-year sustainable consumption and production framework
SDG Indicator 12.1.1Sustainable consumption and production action plans
Definition of the SDG indicator: Indicator 12.1.1 is the “number of countries developing, adopting, or implementing policy instruments aimed at supporting the shift to sustainable consumption and production” in the UN SDG framework.
The UN defines sustainable production and consumption as: “the use of services and related products, which respond to basic needs and bring a better quality of life while minimising the use of natural resources and toxic materials as well as the emissions of waste and pollutants over the life cycle of the service or product so as not to jeopardise the needs of future generation.”
This does not measure the quality or ambition of these plans, only whether a country has one.
Data for this indicator is shown in the interactive visualization.
Target: “Implement the 10-Year Framework of Programmes on Sustainable Consumption and Production Patterns” with all countries taking action by 2030.1

Target 12.2Sustainable management and use of natural resources
SDG Indicator 12.2.1Material footprint
Definition of the SDG indicator: Indicator 12.2.1 is “material footprint, material footprint per capita, and material footprint per GDP” in the UN SDG framework.
Material Footprint (MF) is the attribution of global material extraction to domestic final demand of a country. The total material footprint is the sum of the weight of the used biomass, fossil fuels, metal ores and non-metal ores.
It is measured on the basis of consumption, which means that it is a country’s domestic material footprint adjusted for trade.
Data on this indicator for material footprint per capita and per unit of GDP is shown in the interactive visualizations. This is currently only available as global estimates.
Target: “By 2030, achieve the sustainable management and efficient use of natural resources.”

SDG Indicator 12.2.2Domestic material consumption
Definition of the SDG indicator: Indicator 12.2.2 is “domestic material consumption, domestic material consumption per capita, and domestic material consumption per GDP” in the UN SDG framework.
Domestic Material Consumption measures the total amount of material directly used in an economy. It measures material production, rather than consumption because it is not adjusted for trade.
“Materials” include biomass, fossil fuels, metal ores and non-metallic minerals.
Data on this indicator for domestic material consumption per capita and per unit of GDP is shown in the interactive visualizations.
Target: “By 2030, achieve the sustainable management and efficient use of natural resources.”

Target 12.3Halve global per capita food waste
SDG Indicator 12.3.1Global food loss
Definition of the SDG indicator: Indicator 12.3.1 is the “(a) global food loss index and (b) food waste index” in the UN SDG framework.
The ‘Food Loss Index’ measures how losses in the food supply chain have changed relative to 2015.
Food ‘losses’ are defined as the loss or wastage of food from the farm up to the retail level. Pre-harvest losses, and retail and consumer waste are not included.
Data for this metric is shown in the interactive visualization.
Target: By 2030 “halve per capita global food waste at the retail and consumer levels and reduce food losses along production and supply chains, including post-harvest losses.”

Target 12.4Responsible management of chemicals and waste
SDG Indicator 12.4.1International agreements on hazardous waste
Definition of the SDG indicator: Indicator 12.4.1 is the “number of parties to international multilateral environmental agreements on hazardous waste, and other chemicals that meet their commitments and obligations in transmitting information as required by each relevant agreement” in the UN SDG framework.
There are a number of international multilateral agreements on hazardous waste and other chemicals (including the Montreal Protocol, Basel Convention, Rotterdam Convention and Stockholm Convention).
This metric shows the share of required information that has been submitted to international organizations as part of each agreement.
Target: “Achieve the environmentally sound management of chemicals and all wastes throughout their life cycle, in accordance with agreed international frameworks” by 2020.2
Unlike most SDG targets which are set for the year 2030, this indicator is set for 2020.

SDG Indicator 12.4.2Hazardous waste generation
Definition of the SDG indicator: Indicator 12.4.2 is “(a) hazardous waste generated per capita; and (b) proportion of hazardous waste treated, by type of treatment” in the UN SDG framework.
Hazardous waste is defined as waste that is harmful to human health, or the environment. This indicator captures how much hazardous waste is generated, and how it is treated or disposed of.
Target: “Achieve the environmentally sound management of chemicals and all wastes throughout their life cycle, in accordance with agreed international frameworks” by 2020.2
Unlike most SDG targets which are set for the year 2030, this indicator is set for 2020.

Target 12.5Substantially reduce waste generation
SDG Indicator 12.5.1Recycling rates
Definition of the SDG indicator: Indicator 12.5.1 is the “national recycling rate, tons of material recycled” in the UN SDG framework.
This includes various types of material recycling such as municipal (household) waste and electronic waste.
Limited data is available for recycling rates globally.
The first visualization shows the total quantity of municipal waste – that is, waste from households and businesses, that would be collected by local authorities – that is recycled.
The second visualization shows the percentage of electronic waste that is recycled in each region.
Target: “By 2030, substantially reduce waste generation through prevention, reduction, recycling and reuse.”

Target 12.6Encourage companies to adopt sustainable practices and sustainability reporting
SDG Indicator 12.6.1Companies publishing sustainability reports
Definition of the SDG indicator: Indicator 12.6.1 is the “number of companies publishing sustainability reports” in the UN SDG framework.
These metrics are split by the number of countries that meet the minimum requirements for reporting, at least.
Data for this indicator is shown in the interactive visualization.
Target: “Encourage companies, especially large and transnational companies, to adopt sustainable practices and to integrate sustainability information into their reporting cycle” by 2030.

Target 12.7Promote sustainable public procurement practices
SDG Indicator 12.7.1National sustainable procurement plans
Definition of the SDG indicator: Indicator 12.7.1 is the “number of countries implementing sustainable public procurement policies and action plans” in the UN SDG framework.
Data on this indicator is shown in the interactive visualization.
Target: “Promote public procurement practices that are sustainable, in accordance with national policies and priorities” by 2030.

Target 12.8Promote universal understanding of sustainable lifestyles
SDG Indicator 12.8.1Understanding of sustainable lifestyles
Definition of the SDG indicator: Indicator 12.8.1 is the “extent to which (i) global citizenship education and (ii) education for sustainable development are mainstreamed in (a) national education policies; (b) curricula; (c) teacher education; and (d) student assessment” in the UN SDG framework.
Data for this indicator is shown in the interactive visualization.
Target: “Ensure that people everywhere have the relevant information and awareness for sustainable development and lifestyles in harmony with nature” by 2030.

Target 12.aSupport developing countries' scientific and technological capacity for sustainable consumption and production
SDG Indicator 12.a.1Support for developing countries' capacity for sustainable production
Definition of the SDG indicator: Indicator 12.a.1 is the “installed renewable energy-generating capacity in developing countries (in watts per capita)” in the UN SDG framework.
Renewable energy is defined as hydropower; marine (ocean, tidal and wave); wind; solar (photovoltaic and thermal energy); bioenergy; and geothermal energy.
Data for this indicator is shown in the interactive visualization.
Target: “Support developing countries to strengthen their scientific and technological capacity to move towards more sustainable patterns of consumption and production” through 2030.

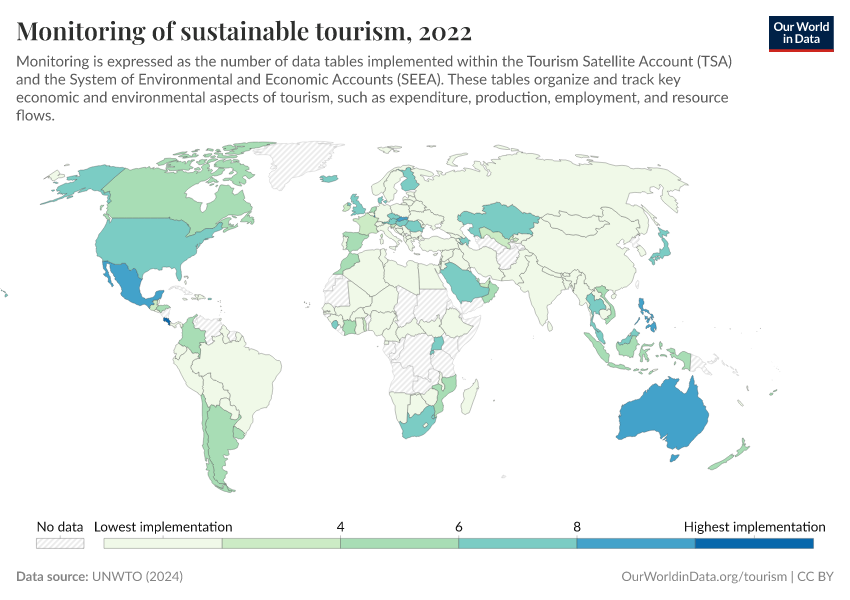
Target 12.bDevelop and implement tools to monitor sustainable tourism
SDG Indicator 12.b.1Monitoring sustainable tourism
Definition of the SDG indicator: Indicator 12.b.1 is the “implementation of standard accounting tools to monitor the economic and environmental aspects of tourism sustainability” in the UN SDG framework.
Data for this indicator is shown in the interactive visualization.
Target: By 2030 “Develop and implement tools to monitor sustainable development impacts for sustainable tourism that creates jobs and promotes local culture and products.”

Target 12.cRemove market distortions that encourage wasteful consumption
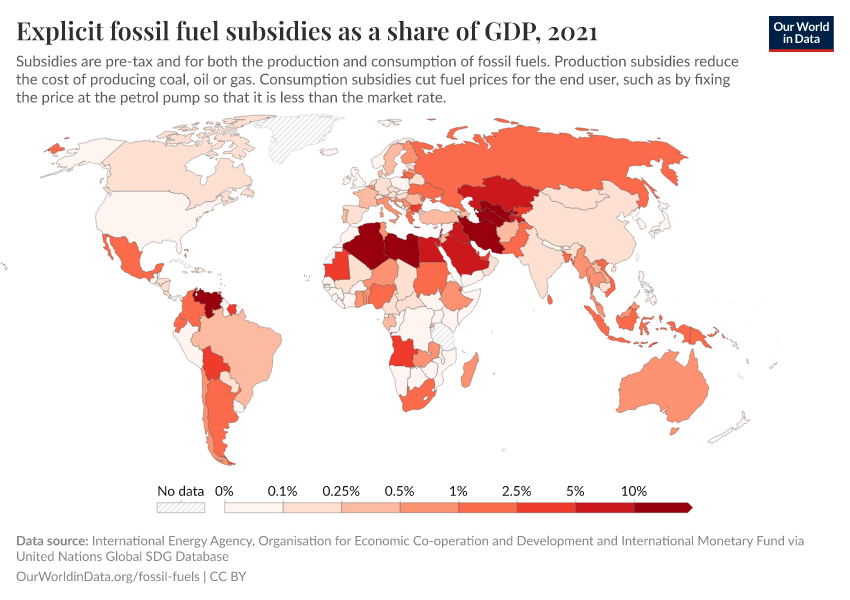
SDG Indicator 12.c.1Removing fossil fuel subsidies
Definition of the SDG indicator: Indicator 12.c.1 is the “Amount of fossil-fuel subsidies (production and consumption) per unit of GDP” in the UN SDG framework.
This includes pre-tax subsidies for both production and consumption of fossil fuels, as a share of total gross domestic product. Production subsidies reduce the cost of producing coal, oil or gas. Consumption subsidies cut fuel prices for the end user, such as by fixing the price at the petrol pump so that it is less than the market rate.
Data for this indicator is shown in the interactive visualization.
Target: By 2030 “rationalize inefficient fossil-fuel subsidies that encourage wasteful consumption by removing market distortions, in accordance with national circumstances, including by restructuring taxation and phasing out those harmful subsidies, where they exist, to reflect their environmental impacts, taking fully into account the specific needs and conditions of developing countries and minimizing the possible adverse impacts on their development in a manner that protects the poor and the affected communities.”

Endnotes
Full text: “Implement the 10-Year Framework of Programmes on Sustainable Consumption and Production Patterns, all countries taking action, with developed countries taking the lead, taking into account the development and capabilities of developing countries.”
Full text: “By 2020, achieve the environmentally sound management of chemicals and all wastes throughout their life cycle, in accordance with agreed international frameworks, and significantly reduce their release to air, water and soil in order to minimize their adverse impacts on human health and the environment.”
Cite this work
Our articles and data visualizations rely on work from many different people and organizations. When citing this article, please also cite the underlying data sources. This article can be cited as:
Our World in Data team (2023) - “Ensure sustainable consumption and production patterns” Published online at OurWorldinData.org. Retrieved from: 'https://archive.ourworldindata.org/20260205-144556/sdgs/responsible-consumption-production.html' [Online Resource] (archived on February 5, 2026).BibTeX citation
@article{owid-sdgs-responsible-consumption-production,
    author = {Our World in Data team},
    title = {Ensure sustainable consumption and production patterns},
    journal = {Our World in Data},
    year = {2023},
    note = {https://archive.ourworldindata.org/20260205-144556/sdgs/responsible-consumption-production.html}
}
Reuse this work freely
All visualizations, data, and code produced by Our World in Data are completely open access under the Creative Commons BY license. You have the permission to use, distribute, and reproduce these in any medium, provided the source and authors are credited.
The data produced by third parties and made available by Our World in Data is subject to the license terms from the original third-party authors. We will always indicate the original source of the data in our documentation, so you should always check the license of any such third-party data before use and redistribution.
All of our charts can be embedded in any site.