Malaria
The deadly disease transmitted by mosquitoes is one of the leading causes of death in children. How did we eliminate the disease in some world regions and how can we continue progress against malaria?
This article was first published in November 2015, and last revised in February 2024.
Malaria is a disease that is spread between people via infected mosquitoes. The bite of an infected Anopheles mosquito transmits a Plasmodium parasite that enters the victim’s blood and travels into the person’s liver, where it reproduces. The parasites then travel through the bloodstream and enter red blood cells, where they rapidly reproduce and burst red blood cells open; this repeats in cycles, leading to cycles of high fevers with shaking chills, and pain. In the worst cases, malaria leads to coma and death.
The parasites are single-celled microorganisms of the Plasmodium group. Plasmodium falciparum is the most lethal in humans, and responsible for most deaths.
Over half a million people died from the disease each year in the 2010s. Most were children, and the disease is one of the leading causes of child mortality.
For an overview of malaria — and how we can make progress against it — you can read the following essay:

Malaria: One of the leading causes of child deaths, but progress is possible and you can contribute to it
We do not have to live in a world in which 1320 children die from a preventable disease every day.
See all interactive charts on malaria ↓
Malaria deaths
In the visualizations we provide estimates of the total number of deaths from the World Health Organization (WHO) from 2000 onwards, and the Institute of Health Metrics and Evaluation (IHME), Global Burden of Disease (GBD) from 1990 onwards.
These estimates are notably different across various countries which affects the total number of reported deaths. IHME figures, as shown, tend to be higher.
Malaria death estimates from WHO
The WHO has published estimates of the global number of people who die from malaria since 2000. This is shown in the chart.
The WHO estimates that the global death toll fell steadily between 2000 and 2015. Since then, progress has slowed. The number of deaths increased in 2020 as a result of disruptions during the COVID-19 pandemic.1
Africa is the world region that is most affected by malaria. In recent years, the vast majority of deaths from malaria occurred on the African continent. But Africa is also the world region that has achieved most progress.
Malaria death estimates from IHME
The Institute of Health Metrics and Evaluation (IHME) has published estimates of the global number of people who die from malaria since 1990. This is shown in the chart.
The IHME estimates a rise, peak and fall between 1990 and 2017.
These estimates are notably higher than those of the WHO. Although divergent on the total number of malaria deaths, both the IHME and WHO estimate that the vast majority of deaths are in the African region.
Malaria deaths by age group
The chart below breaks down the annual number of deaths by age group.
These figures are those published by the IHME’s Global Burden of Disease study — the WHO does not publish country-level data on malaria deaths by age. Note that you can view these trends for any country in the chart.
It shows that the most vulnerable age group to malaria deaths are children under five years old.
Malaria death rates
The visualization shows the age-standardized death rate from malaria, measured as the death rate per 100,000 people in the population.
New cases of malaria
The map shows the number of new cases of malaria per 100,000 people across the world. As the chart shows, malaria cases are most common in the central part of Africa north and south of the equator.
The history of malaria
Humanity’s fight against malaria has a history of many thousand years.2
For most of that time, humanity was exposed to the disease without any defense.
Malaria’s mark on the human body
The history of humanity is so closely entangled with the history of malaria that the disease left its mark on our bodies.
Sickle cell disorder is one of these marks. It is a genetic condition that deforms red blood cells to be sickle-shaped. Carriers suffer from attacks of pain from a young age and their lives are cut short by the condition. Tens of thousands of people globally die from the disease each year.3
Why would such a genetic mutation not die out? The reason for the continued existence is that sickle cell disorder hinders the malaria parasite from reproducing, which means people who are carriers of the mutation — with one out of two mutations for it — have a protective advantage in environments where malaria exists.
The prevalence of sickle cell disorder today is a testament to the high-malaria environments in our species’ history.4
Malaria’s mark on history
Malaria did not only leave its mark on our bodies, but in many ways also on our history. Malaria is thought to have been a secret ally that helped the Germanic and other tribes bring about the downfall of Rome.
By examining the teeth and bones of the Romans, archaeologists have brought together more and more evidence that the mosquito-borne fever once thrived in the warm, marshy river valleys of the Tiber and the Po in the Roman empire. The disease enfeebled the mightiest army of the ancient world directly through epidemics and indirectly by reducing the productivity in the agricultural sector and hastened the fall of Rome.5
This disease that was powerful enough to afflict the mightiest armies also left its mark on the fate of societies and the lives of many other regions of the world.6
Malaria’s mark on our drinks
One of the first treatments people discovered against malaria was quinine, which came from an extract from the bark of the cinchona tree in South America.7
Quinine powder was either drunk with wine or dissolved in water, a mixture that became known as “tonic water”. But quinine is so bitter that tonic water, with concentrations high enough to be effective against malaria, was unpleasant to drink. The British colonial officers stationed in malarious India therefore started to add sugar, lime, and gin to it, and thereby created a drink that is still popular today: gin and tonic.
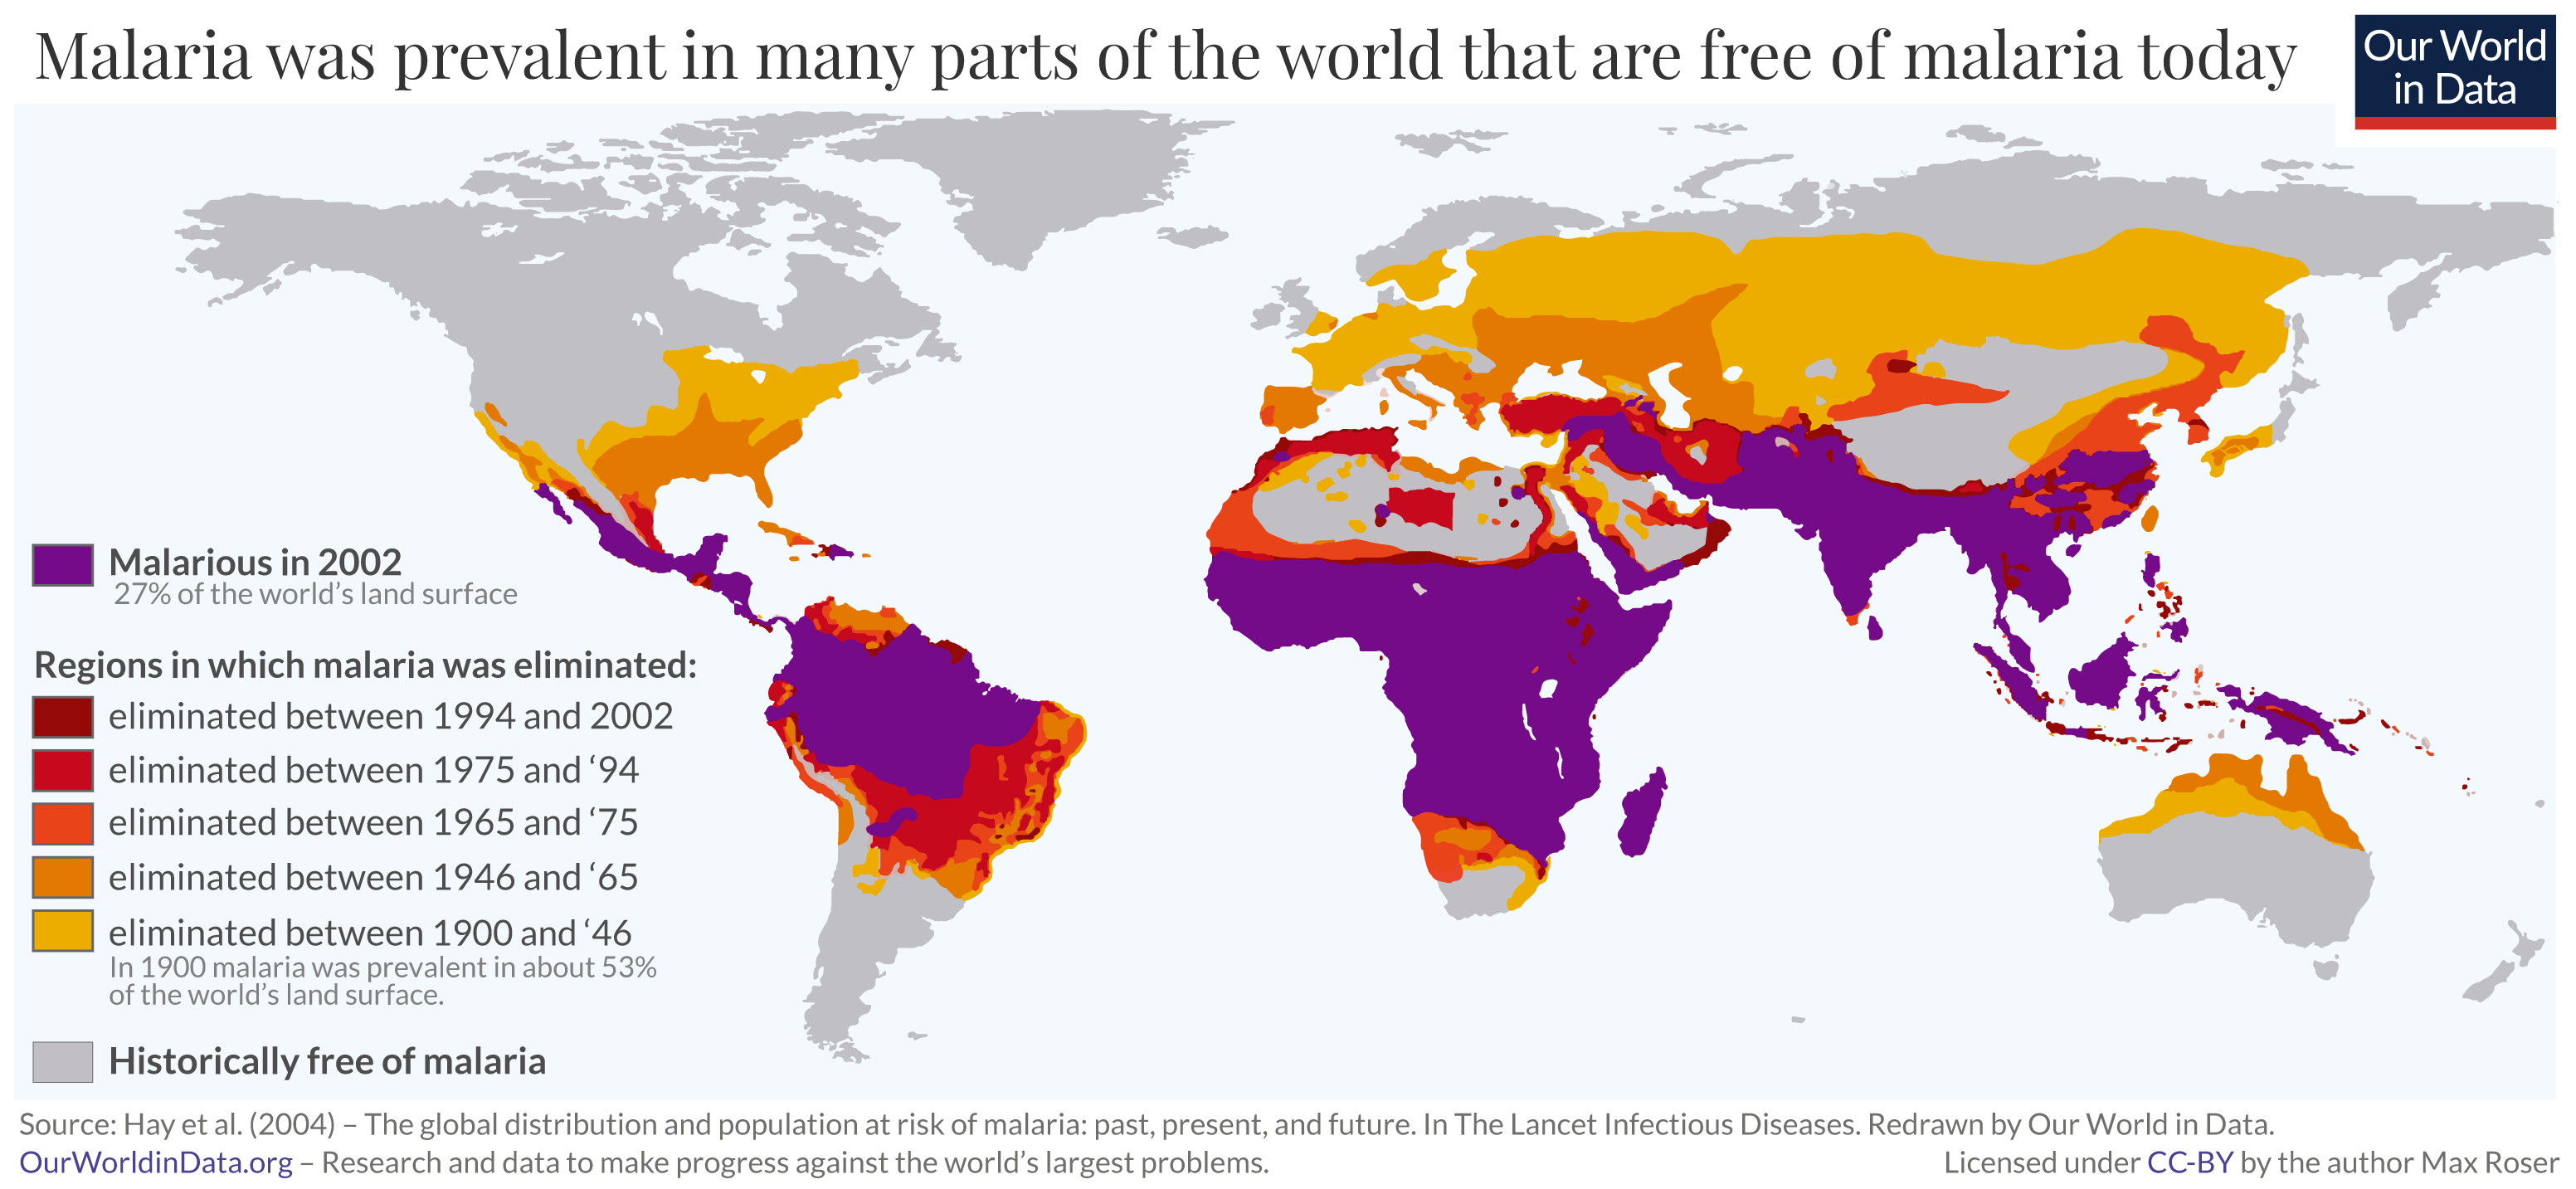
Malaria was common across half the world — since then it has been eliminated in many regions
Malaria left its mark on our history, our bodies, our drinks, and for thousands of years, caused the deaths of people all around the world.
But in the last few generations, humanity gained ground in this long-lasting battle against the disease. The map shows in which regions of the world malaria is prevalent today (in purple) and where it was prevalent in the past.

Just a few generations ago malaria was common in many more places around the world than it is today. Over the 20th century, the disease was eliminated in many populous regions of the world, saving the lives of millions.
What the map makes clear is that malaria is not a tropical disease, but a disease that was eliminated everywhere except for the tropics.
Historically, malaria was prevalent in Europe and North America — the poet Friedrich Schiller contracted the disease in Mannheim, Oliver Cromwell in Ireland, and Abraham Lincoln in Illinois.9
Since then the disease has been eliminated not only there, but also in East Asia and Australia and many parts in the Caribbean, South America, and Africa.
The researchers estimate that historically — and up to around 1900 — our ancestors were at risk from malaria across about half of the world’s land surface. By 2002, the area where humans are at risk of malaria contracted to a quarter (27%).8
Why are these parts not malarious anymore?
Three factors were responsible for this global reduction of malarious regions:10
First, public health measures, especially the widespread use of insecticides to attack the mosquito.
Second, drainage of swampland to expand agricultural land, which had the side effect of restricting breeding grounds for mosquitoes.
Third, social and economic development, which made treatment available to those who were infected, and also led to improvements in housing conditions and mosquito nets, which lowered the chances of infection in the first place.
All three factors — insecticides, land use change, and economic development — were major reasons that Europe and the other regions shown in shades of yellow, orange, and red are free of malaria today.
Malaria in the US
The map is taken from the US census from 1870. It shows in detail what the previous section discussed. Shown is the share of all deaths caused by malaria in the American Southeast at that time.
Malaria was very prevalent in this region in the past. Particularly along the coasts and along the Mississippi, malaria killed many Americans.

How can the world continue to make progress against malaria?
The world has already been very successful against this disease which is one of the deadliest diseases in humanity's history. How was this possible and what can we do to continue this progress?
Insecticide-treated bednets
The world is making progress against malaria thanks to insecticide-treated bednets
Even after a century of progress against malaria, the disease remains devastating for millions. The World Health Organization estimates that 216 million suffered from the disease in 2016.12
Fortunately, only a small fraction of malaria victims die of the disease. But those who die are the very weakest; three out of four malaria victims are children younger than 5 years old making it one of the leading causes of child mortality in the world today.13
The world is making progress against malaria
One line of humanity’s attack on malaria is to progressively reduce the area in which malaria is prevalent. Another one is to prevent the transmission of the parasite in regions where it is still prevalent. It is a surprisingly simple technology that stopped transmission and saved the lives of millions in the last few years alone.
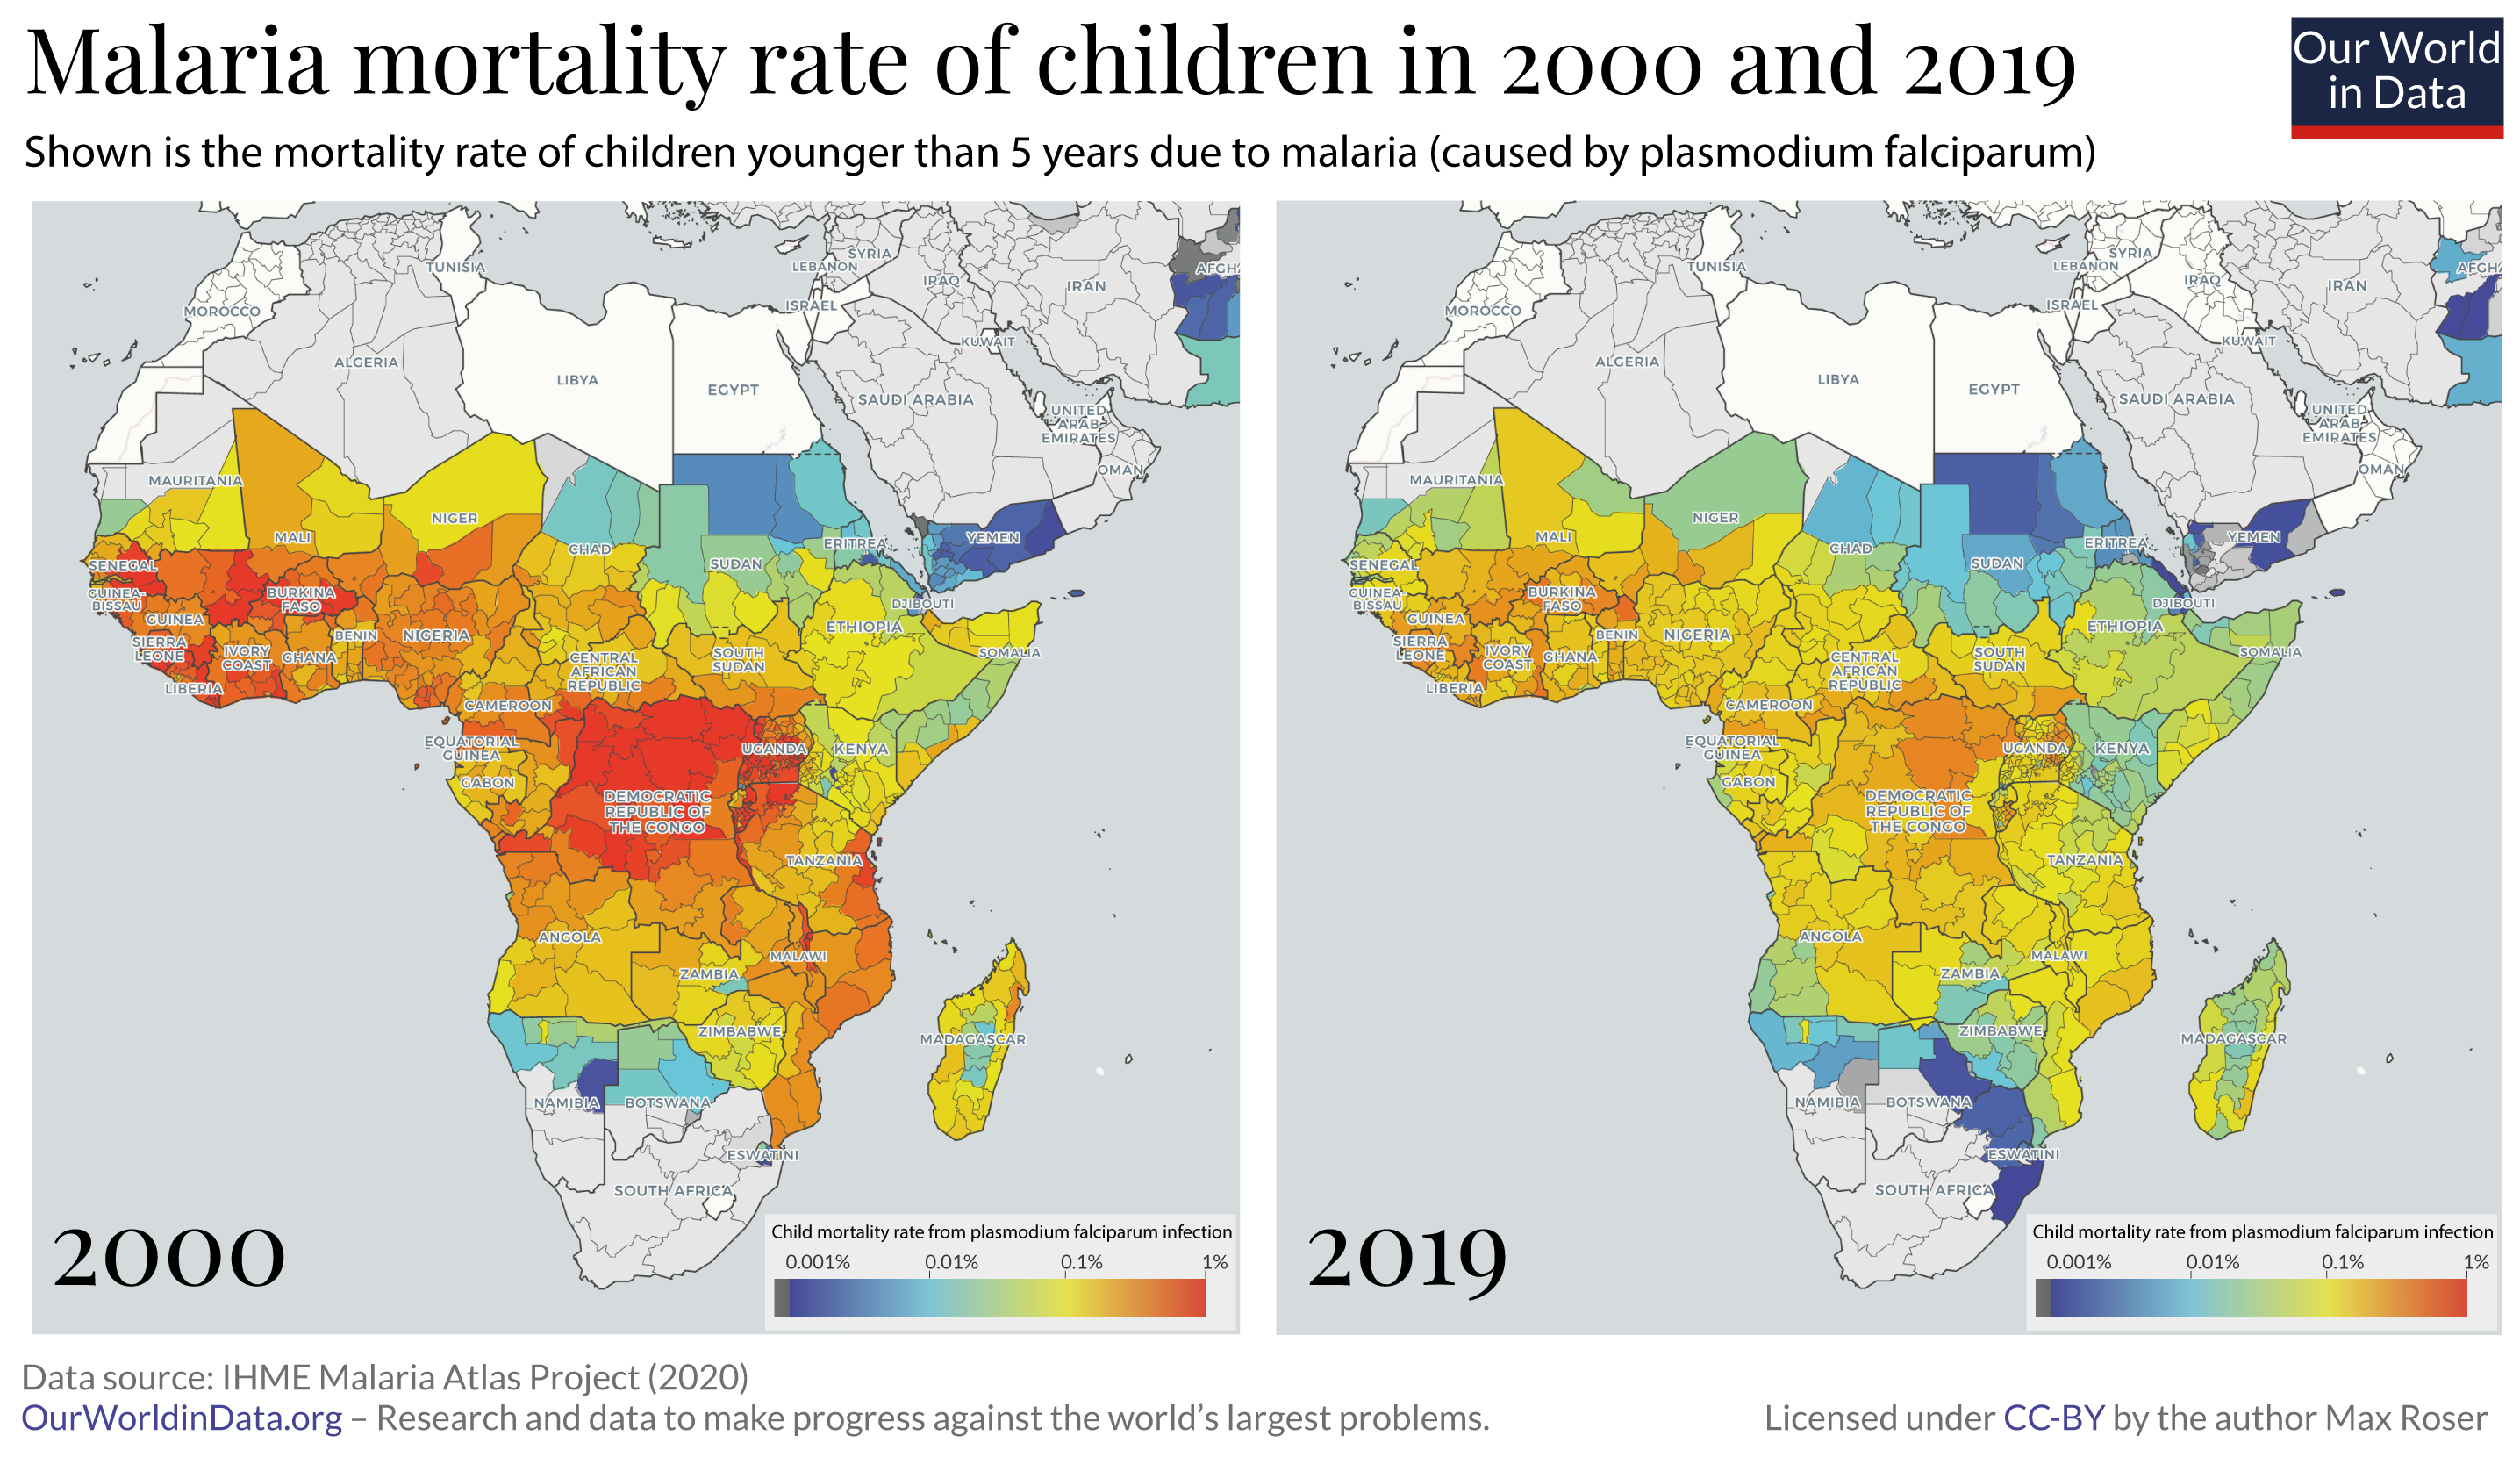
The years since the turn of the millennium were an extraordinarily successful era in the fight against malaria. The two maps show the change in malaria mortality for children in the region where the disease causes the highest death toll.14

One of the most important contributors to the decline was the increased distribution of insecticide-treated bed nets.
Bed nets protect those who sleep under them, and the insecticide used on the bed nets kills the mosquitoes. So a community where a sufficiently high number of people sleep under bed nets the entire community is protected, regardless of whether they use the bed nets themselves. This is similar to the positive externality effect that vaccination has on communities.
Two other interventions that were important for the reduction in the disease burden of malaria were indoor residual spraying (IRS) of insecticides, and the treatment of malaria patients with artemisinin-based combination therapy (ACT).
Read more in our article:

Malaria: One of the leading causes of child deaths, but progress is possible and you can contribute to it
We do not have to live in a world in which 1320 children die from a preventable disease every day.
Vaccines against malaria
Charles Alphonse Laveran discovered in 1880 that the Plasmodium parasite was the cause of malaria.15 But all earlier attempts to develop vaccines were unsuccessful. Malaria vaccines such as SPf66 were insufficiently effective and until recently none of the scientific efforts led to a licensed vaccine.16
This has changed with the malaria vaccine RTS,S, the world's first licensed malaria vaccine, which has been recommended for use by the WHO since 2021. The vaccine is undergoing pilot trials in select countries and it is hoped to protect against the parasite in the future.17 Since then, another malaria vaccine has also been developed — the R21/Matrix-M vaccine, which has been recommended for use since 2023.
Malaria and economic prosperity
There are high economic costs of malaria
Malaria was once prevalent in many of today's richest countries, but it was eliminated there over the last century. Today, malaria still affects some of the poorest countries in the world, as the chart shows.
This is partly because the poor finances make it hard to fight the disease, but also because the disease lowers the productivity of the economy.
In the chart below, you can see each country’s prevalence of malaria compared to their GDP per capita.
Endnotes
World Malaria Report 2021. Geneva: World Health Organization; 2021.
Wiesenfeld SL (1967) — Sickle-cell trait in human biological and cultural evolution. Science. 157:1134–40. Joy DA, Feng XR, Mu JB, et al. (2003) — Early origin and recent expansion of Plasmodium falciparum. Science. 300:318–21.
The Institute for Health Metrics and Evaluation’s 2019 Global Burden of Disease study estimated that around 40,000 people died from sickle cell disorder in 2019. Results are online here: https://vizhub.healthdata.org/gbd-compare/
See: Aidoo M, Terlouw DJ, Kolczak MS, McElroy PD, ter Kuile FO, Kariuki S, Nahlen BL, Lal AA, Udhayakumar V. (2002) — Protective Effects of the Sickle Cell Gene Against Malaria Morbidity and Mortality. In Lancet 2002; 359:1311-1312.
See Robert Sallares (2001) — Malaria and Rome: A History of Malaria in Ancient Italy and Robert Sallares, Abigail Bouwman and Cecilia Anderung (2012) — The Spread of Malaria to Southern Europe in Antiquity: New Approaches to Old Problems. Online here.
Daron Acemoglu, Simon Johnson, James A. Robinson (2002) — Reversal of Fortune: Geography and Institutions in the Making of the Modern World Income Distribution. In The Quarterly Journal of Economics, Vol. 117, No. 4 (Nov., 2002), pp. 1231-1294. Online here: ttps://economics.mit.edu/files/4127 John Luke Gallup and Jeffrey D. Sachs (2001) — The Economic Burden of Malaria https://www.ncbi.nlm.nih.gov/books/NBK2624/
On the history of the first effective treatments see Kennedy — A Brief History of Disease, Science and Medicine.
The original map was published in Simon I Hay, Carlos A Guerra, Andrew J Tatem, Abdisalan M Noor, and Robert W Snow (2004) — The global distribution and population at risk of malaria: past, present, and future. In The Lancet Infectious Diseases 2004 June; 4(6): 327–336. DOI: 10.1016/S1473-3099(04)01043-6. https://www.thelancet.com/journals/laninf/article/PIIS1473-3099(04)01043-6/fulltext I have digitized the Figure 1 using image tracing in Adobe Illustrator. The historical mapping of the prevalence of malaria is based on the pioneering work of Lysenko in the 1960s: Lysenko AJ, Semashko IN. Geography of malaria (1968) — A medico-geographic profile of an ancient disease. In: Lebedew AW, editor. Itogi Nauki: Medicinskaja Geografija. Academy of Sciences, USSR; Moscow: 1968. pp. 25–146. Lysenko AJ, Beljaev AE (1969) — An analysis of the geographical distribution of Plasmodium ovale. Bull World Health Organization; 40:383–94.
On the cause of Oliver Cromwell’s death see the FAQs at OliverCromwell.org, on Friedrich Schiller see Bayerischer Rundfunk here, on Abraham Lincoln see "The Physical Lincoln". Other famous victims — although it is not always possible to diagnose the disease of historical figures — were German painter Albrecht Dürer, who contracted the disease in the Netherlands, and several popes, who died of the disease as malaria was very prevalent in Italy until recently.
See Hay et al (2004) above and de Zulueta J. (1994) — Malaria and ecosystems: from prehistory to posteradication. In Parassitologia. 1994 August. 36(1-2):7-15. World Bank (2009) — World Development Report (2009) - Part I: Reshaping Economic Geography. Washington, DC: World Bank. Online here.
This is taken from the Statistical Atlas from the 9th Census of the United States 1870 (published 1874). All maps and charts from the Statistical Atlas from the 9th Census of the United States 1870 are online at Radical Cartography here. This map shown here is available in high-resolution here.
Figures for 2016 according to the WHO: http://www.who.int/malaria/en/
The age-specific mortality figures are those published by the IHME’s Global Burden of Disease [the WHO does not publish country-level data on malaria deaths by age]. The share of children younger than 5 among malaria victims fell slightly over the course of the last generation, from 79% in 1990 to 72% in 2015. Here is the data: https://ourworldindata.org/grapher/malaria-deaths-by-age?stackMode=relative
Both the WHO and the IHME report a strong decline of malaria deaths since 2000. But throughout this period the IHME consistently estimates the number of annual deaths to be higher.
See Francis EG Cox (2010) — History of the discovery of the malaria parasites and their vectors. In Parasites and Vectors. Online here.
For an overview see Adrian V. S. Hill (2011) — Vaccines against malaria. In Philos Trans R Soc Lond B Biol Sci. 2011 Oct 12; 366(1579): 2806–2814. doi: 10.1098/rstb.2011.0091.
See RTS,S Clinical Trials Partnership (2015) — Efficacy and safety of RTS,S/AS01 malaria vaccine with or without a booster dose in infants and children in Africa: final results of a phase 3, individually randomised, controlled trial. In The Lancet, Volume 386, ISSUE 9988, P31-45, July 04, 2015. Online here.
Cite this work
Our articles and data visualizations rely on work from many different people and organizations. When citing this topic page, please also cite the underlying data sources. This topic page can be cited as:
Max Roser and Hannah Ritchie (2015) - “Malaria” Published online at OurWorldInData.org. Retrieved from: 'https://ourworldindata.org/malaria' [Online Resource]BibTeX citation
@article{owid-malaria,
    author = {Max Roser and Hannah Ritchie},
    title = {Malaria},
    journal = {Our World in Data},
    year = {2015},
    note = {https://ourworldindata.org/malaria}
}
Reuse this work freely
All visualizations, data, and code produced by Our World in Data are completely open access under the Creative Commons BY license. You have the permission to use, distribute, and reproduce these in any medium, provided the source and authors are credited.
The data produced by third parties and made available by Our World in Data is subject to the license terms from the original third-party authors. We will always indicate the original source of the data in our documentation, so you should always check the license of any such third-party data before use and redistribution.
All of our charts can be embedded in any site.


