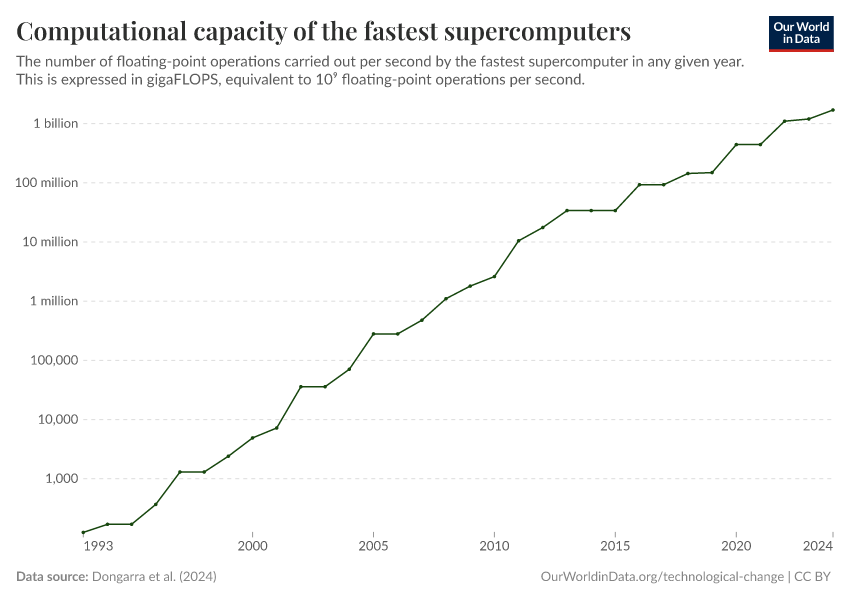
Computational capacity of the fastest supercomputers

What you should know about this indicator
- Computational capacity is measured with the Linpack benchmark, which tests how fast a computer can solve a large, dense set of linear equations.
- This indicator shows the highest sustained Linpack speed achieved by the fastest supercomputer each year, as recorded by the TOP500 project.
- One gigaflop per second (Gflop/s) equals one billion floating-point operations per second.
- The Linpack benchmark tests only one type of computation, so it doesn't capture overall system performance. Real-world applications often perform differently than this benchmark suggests.
Related research and writing
What you should know about this indicator
- Computational capacity is measured with the Linpack benchmark, which tests how fast a computer can solve a large, dense set of linear equations.
- This indicator shows the highest sustained Linpack speed achieved by the fastest supercomputer each year, as recorded by the TOP500 project.
- One gigaflop per second (Gflop/s) equals one billion floating-point operations per second.
- The Linpack benchmark tests only one type of computation, so it doesn't capture overall system performance. Real-world applications often perform differently than this benchmark suggests.
Sources and processing
This data is based on the following sources
How we process data at Our World in Data
All data and visualizations on Our World in Data rely on data sourced from one or several original data providers. Preparing this original data involves several processing steps. Depending on the data, this can include standardizing country names and world region definitions, converting units, calculating derived indicators such as per capita measures, as well as adding or adapting metadata such as the name or the description given to an indicator.
At the link below you can find a detailed description of the structure of our data pipeline, including links to all the code used to prepare data across Our World in Data.
Notes on our processing step for this indicator
Data is aggregated from all TOP500 lists published between 1993 and 2025. For each year, we select the maximum Rmax value across all lists published in that year. Performance values are converted from teraflops per second (TFlop/s) to gigaflops per second (GFlop/s) by multiplying by 1000.
Reuse this work
- All data produced by third-party providers and made available by Our World in Data are subject to the license terms from the original providers. Our work would not be possible without the data providers we rely on, so we ask you to always cite them appropriately (see below). This is crucial to allow data providers to continue doing their work, enhancing, maintaining and updating valuable data.
- All data, visualizations, and code produced by Our World in Data are completely open access under the Creative Commons BY license. You have the permission to use, distribute, and reproduce these in any medium, provided the source and authors are credited.
Citations
How to cite this page
To cite this page overall, including any descriptions, FAQs or explanations of the data authored by Our World in Data, please use the following citation:
“Data Page: Computational capacity of the fastest supercomputers”, part of the following publication: Max Roser, Hannah Ritchie, and Edouard Mathieu (2023) - “Technological Change”. Data adapted from Dongarra et al.. Retrieved from https://archive.ourworldindata.org/20260202-130411/grapher/supercomputer-power-flops.html [online resource] (archived on February 2, 2026).How to cite this data
In-line citationIf you have limited space (e.g. in data visualizations), you can use this abbreviated in-line citation:
Dongarra et al. (2025) – with major processing by Our World in DataFull citation
Dongarra et al. (2025) – with major processing by Our World in Data. “Computational capacity of the fastest supercomputers” [dataset]. Dongarra et al., “TOP500 Supercomputer Lists (1993-2025)” [original data]. Retrieved February 12, 2026 from https://archive.ourworldindata.org/20260202-130411/grapher/supercomputer-power-flops.html (archived on February 2, 2026).