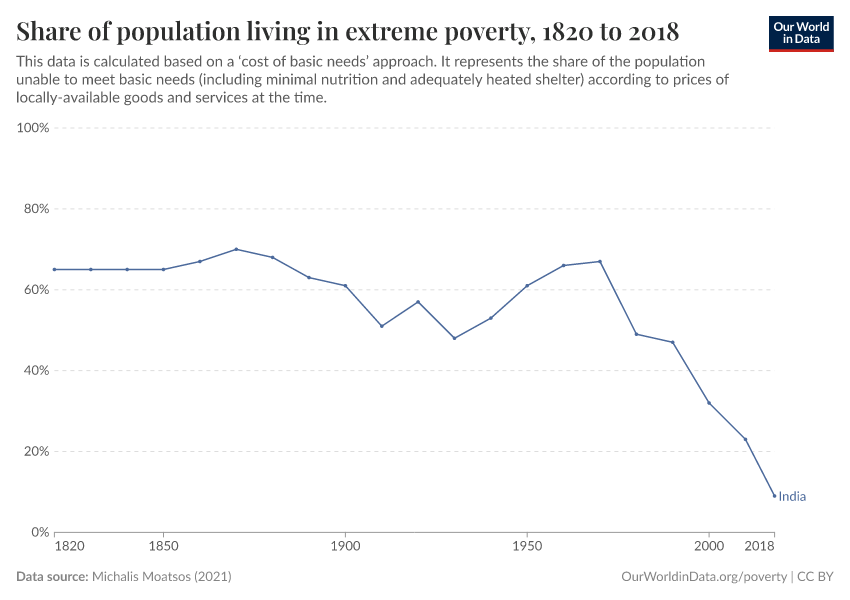
Share of population living in extreme poverty

What you should know about this indicator
- The ‘cost of basic needs’ approach was recommended by the World Bank Commission on Global Poverty, headed by Tony Atkinson, as a complementary method in measuring poverty.
- Moatsos describes the methodology as follows: “In this approach, poverty lines are calculated for every year and country separately, rather than using a single global line. The second step is to gather the necessary data to operationalize this approach alongside imputation methods in cases where not all the necessary data are available. The third step is to devise a method for aggregating countries’ poverty estimates on a global scale to account for countries that lack some of the relevant data.”
Sources and processing
This data is based on the following sources
How we process data at Our World in Data
All data and visualizations on Our World in Data rely on data sourced from one or several original data providers. Preparing this original data involves several processing steps. Depending on the data, this can include standardizing country names and world region definitions, converting units, calculating derived indicators such as per capita measures, as well as adding or adapting metadata such as the name or the description given to an indicator.
At the link below you can find a detailed description of the structure of our data pipeline, including links to all the code used to prepare data across Our World in Data.
Notes on our processing step for this indicator
From the share and number unable to meet basic needs available in the dataset, we can estimate the number below different "dollar a day" poverty lines. Additionally, we estimate the share and number above these poverty lines, as well between them. We also estimate the share and number of people able to meet basic needs.
Reuse this work
- All data produced by third-party providers and made available by Our World in Data are subject to the license terms from the original providers. Our work would not be possible without the data providers we rely on, so we ask you to always cite them appropriately (see below). This is crucial to allow data providers to continue doing their work, enhancing, maintaining and updating valuable data.
- All data, visualizations, and code produced by Our World in Data are completely open access under the Creative Commons BY license. You have the permission to use, distribute, and reproduce these in any medium, provided the source and authors are credited.
Citations
How to cite this page
To cite this page overall, including any descriptions, FAQs or explanations of the data authored by Our World in Data, please use the following citation:
“Data Page: Share of population living in extreme poverty”. Our World in Data (2026). Data adapted from Michalis Moatsos. Retrieved from https://archive.ourworldindata.org/20250909-093708/grapher/share-of-population-living-in-extreme-poverty-lines-cbn.html [online resource] (archived on September 9, 2025).How to cite this data
In-line citationIf you have limited space (e.g. in data visualizations), you can use this abbreviated in-line citation:
Michalis Moatsos (2021) – with major processing by Our World in DataFull citation
Michalis Moatsos (2021) – with major processing by Our World in Data. “Share of population living in extreme poverty – Long-run estimates - Cost of basic needs” [dataset]. Michalis Moatsos, “Global extreme poverty - Present and past since 1820” [original data]. Retrieved January 2, 2026 from https://archive.ourworldindata.org/20250909-093708/grapher/share-of-population-living-in-extreme-poverty-lines-cbn.html (archived on September 9, 2025).