Data

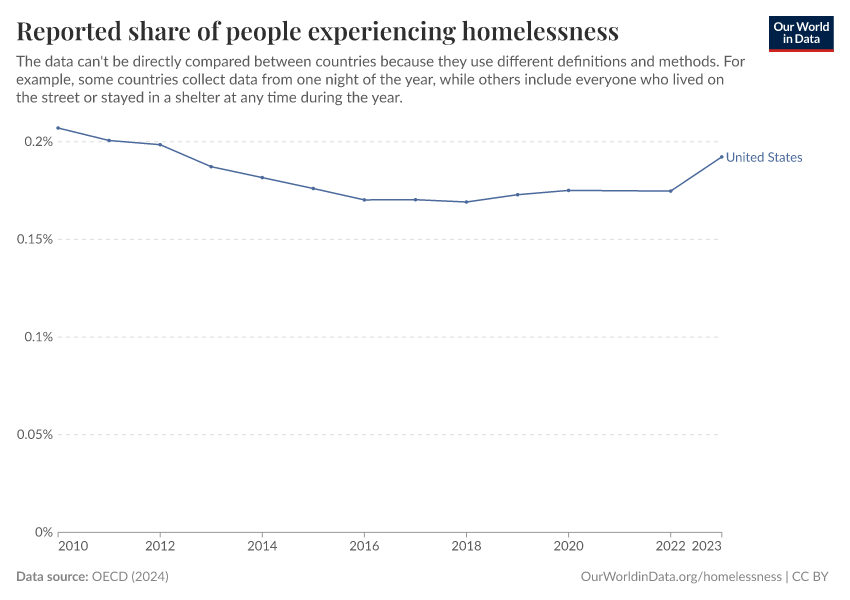
Share of people experiencing homelessness
See all data and research on:

What you should know about this indicator

  • Countries use different definitions and data collection methods and are harmonized to the extent possible.
  • Data for the United Kingdom only considers England.
  • Data for Ireland refers to October of each year.
  • Data for the United Kingdom refers to households to Q2 (April-June) of each year.
  • Data refers to point-in-time data (collected at one point in time), except for Austria, Latvia and Slovenia, which refers to flow data (collected at a given period of time).
  • More details about definitions, methodology and comparability issues can be found in the OECD Population Experiencing Homelessness documentation.
  • For more information on the statistical definitions for each country, please check the OECD's Country Notes on Homelessness data.

Definitions and methodology

This indicator presents available data at national level on the number of people experiencing homelessness as reported by public authorities in OECD and EU countries. Data are drawn from the 2023 OECD Questionnaire on Affordable and Social Housing (QuASH 2023) and other available sources. Overall, homelessness data are available for 40 countries: all OECD countries except Hungary; and the following non-member countries: Croatia, Cyprus and Romania (Table HC 3.1.A1).

Comparing homeless estimates across countries is difficult, as countries do not define or count the population experiencing homelessness in the same way. There is no internationally agreed definition of homelessness. Therefore, this indicator presents a collection of available statistics on homelessness in OECD, EU and key partner countries in line with national definitions, drawing on the ETHOS Light typology to the extent feasible (see Box HC 3.1).

In general, the type of count can be differentiated between point-in-time counts and flow counts, which are defined below:

  • Point-in-time count: Data are collected at a single point-in-time, generally through a coordinated street count and/or an enumeration of people staying in shelters for people experiencing homelessness on a given night. Point-in-time counts thus present a “snapshot” of homelessness at a single time and place.

  • Flow count: Data are collected over a given period of time, such as the enumeration of all people who have stayed in a shelter over the course of the year. Point-in-time and flow data are not comparable, and are thus presented separately in this indicator. For additional discussion of the methodological challenges to homelessness data collection, see the section on Data and comparability issues below.

Data and comparability issues

Significant methodological challenges stymy data collection on homelessness.

Definitional differences

As discussed above, differences in statistical definitions drive some of the variation in the reported incidence of homelessness across countries; these differences hamper international comparison and an understanding of the differences in homelessness rates and risks across countries. For instance, several countries that adopt a broader definition of homelessness report a higher incidence of homelessness, like Australia and New Zealand, relative to countries with a narrower definition, such as Chile, Portugal or Japan.

However, definitional differences do not fully explain the variation in homelessness rates across countries: several countries with a broad definition of homelessness report among the lowest incidences of homelessness, such as Norway, Poland, Finland and Denmark. Figure HC3.1 (above) accounts for these definitional differences by presenting cross-country data on homelessness for ETHOS Light categories 1, 2 and 3 only.

Different definitions of homelessness can co-exist within the same country, depending on the purpose and the collecting authority, producing considerable differences in homelessness estimates for the same territory. In the United States, for instance, the definition of homelessness used by the Department of Housing and Urban Development (HUD) – which is used to allocate federal funds to local authorities to address homelessness – is narrower than that used by the Department of Education (Evans, Phillips and Ruffini, 2019), which forms the basis of funding allocation to school districts to support children and youth experiencing homelessness. The result is two significantly different estimates of homelessness in the United States: while HUD estimated that over 580 000 people experienced homelessness on a single night in January 2022, the Department of Education reported 1.28 million children and youth nationally experienced homelessness at some point over the 2019-20 school year (this figure is exclusive of their parents) (US Interagency Council on Homelessness, 2024).

Limitations of data collection approaches

Beyond definitional differences, there are a number of challenges in the scope and methods of data collection that might affect measuring the full extent of homelessness (see the forthcoming OECD Monitoring Framework on Homelessness). Data on homelessness are typically based on the following collection methods, each with its strengths and limitations in terms of how well it captures different types of living situations:

  • Street counts: an estimate of the number of people sleeping rough at a point-in-time;

  • Service-based methods: information obtained from a broad range of service providers that support people experiencing homelessness;

  • Population censuses and Household surveys: a count or a sample of a given population at a point in time (e.g. Population Census; special module on homelessness in household survey);

  • Administrative data: records collected by different institutions/organisations (e.g., health data, criminal justice records, social services data, etc.) and used to extrapolate the number of people experiencing homelessness;

  • Advanced sampling methods: a statistical method, such as “capture-recapture,” comparing independent samples from two or more sources of data to estimate the total number of people experiencing homelessness;

  • By-name lists and Information management systems on homeless individuals: the collection of comprehensive demographic and identifying information on people experiencing homelessness, which may be collected via registry weeks.

The type of housing solution of someone experiencing homelessness – whether it is a shelter or emergency accommodation service, temporary lodging with family or friends, or living out of a car or on the street – will be better reflected in some data collection methods relative to others. Further, the scope, design and implementation of each data collection approach varies widely, which can significantly affect the quality and coverage of the data. For instance, with respect to street counts, the geographic perimeter is not systematic across (or even within) countries. In addition to counting rough sleepers on public streets, street counts may (or may not) include parks, public transport, emergency rooms, parking garages or other places that, depending on the country context, may be used by rough sleepers.

Moreover, in the case of service-based methods, there is no systematic approach to determining which types of services and emergency or temporary accommodation are included in data collection efforts, and which are left out. The selection of services to be surveyed may be narrowly defined (e.g., restricted to overnight shelters and temporary accommodation), or may be quite broad (e.g., to also include food banks, social service centres, health clinics, etc.). As a result, homelessness data resulting from service-based methods (often captured by ETHOS Light 2 and 3) are not fully comparable across countries. Table HC3.1.1 provides an overview of cross-country differences in the inclusion of children and temporary accommodation for specific groups in the national headline estimate of homelessness.

Across 40 OECD and EU countries:

  • Over half (26 countries) include children under the age of 18 years;

  • Around 40% (17 countries) include temporary accommodation for victims of domestic violence;

  • Around 30% (12 countries) include temporary accommodation for refugees; and

  • Less than a quarter (9 countries) include temporary accommodation for asylum seekers.

Share of people experiencing homelessness
Due to different definitions and data collection methods, the share of people experiencing homelessness is not directly comparable across countries.
Source
OECD (2024) – with minor processing by Our World in Data
Last updated
April 30, 2024
Next expected update
April 2025
Date range
2010–2023
Unit
%

Sources and processing

This data is based on the following sources

The OECD Affordable Housing Database (AHD) helps countries monitor access to good-quality affordable housing and strengthen the knowledge base for policy evaluation. It brings together cross-national information from OECD countries, Key Partners and EU member states.

The database groups indicators along three dimensions: housing market, housing conditions and affordability, and public policies towards affordable housing. Each indicator presents data, relevant definitions and methodology, and key results. Indicators also discuss comparability, data issues, and, where relevant, include the raw data or descriptive information across countries.

Retrieved on
May 24, 2024
Citation
This is the citation of the original data obtained from the source, prior to any processing or adaptation by Our World in Data. To cite data downloaded from this page, please use the suggested citation given in Reuse This Work below.
OECD (2024). Affordable Housing Database (AHD) - Housing conditions: People experiencing homelessness, https://www.oecd.org/housing/data/affordable-housing-database/

How we process data at Our World in Data

All data and visualizations on Our World in Data rely on data sourced from one or several original data providers. Preparing this original data involves several processing steps. Depending on the data, this can include standardizing country names and world region definitions, converting units, calculating derived indicators such as per capita measures, as well as adding or adapting metadata such as the name or the description given to an indicator.

At the link below you can find a detailed description of the structure of our data pipeline, including links to all the code used to prepare data across Our World in Data.

Read about our data pipeline

Reuse this work

  • All data produced by third-party providers and made available by Our World in Data are subject to the license terms from the original providers. Our work would not be possible without the data providers we rely on, so we ask you to always cite them appropriately (see below). This is crucial to allow data providers to continue doing their work, enhancing, maintaining and updating valuable data.
  • All data, visualizations, and code produced by Our World in Data are completely open access under the Creative Commons BY license. You have the permission to use, distribute, and reproduce these in any medium, provided the source and authors are credited.

Citations

How to cite this page

To cite this page overall, including any descriptions, FAQs or explanations of the data authored by Our World in Data, please use the following citation:

“Data Page: Share of people experiencing homelessness”, part of the following publication: Esteban Ortiz-Ospina and Max Roser (2017) - “Homelessness”. Data adapted from OECD. Retrieved from https://ourworldindata.org/grapher/share-of-people-experiencing-homelessness [online resource]
How to cite this data

In-line citationIf you have limited space (e.g. in data visualizations), you can use this abbreviated in-line citation:

OECD (2024) – with minor processing by Our World in Data

Full citation

OECD (2024) – with minor processing by Our World in Data. “Share of people experiencing homelessness” [dataset]. OECD, “OECD Affordable Housing Database (AHD)” [original data]. Retrieved June 15, 2024 from https://ourworldindata.org/grapher/share-of-people-experiencing-homelessness