Data

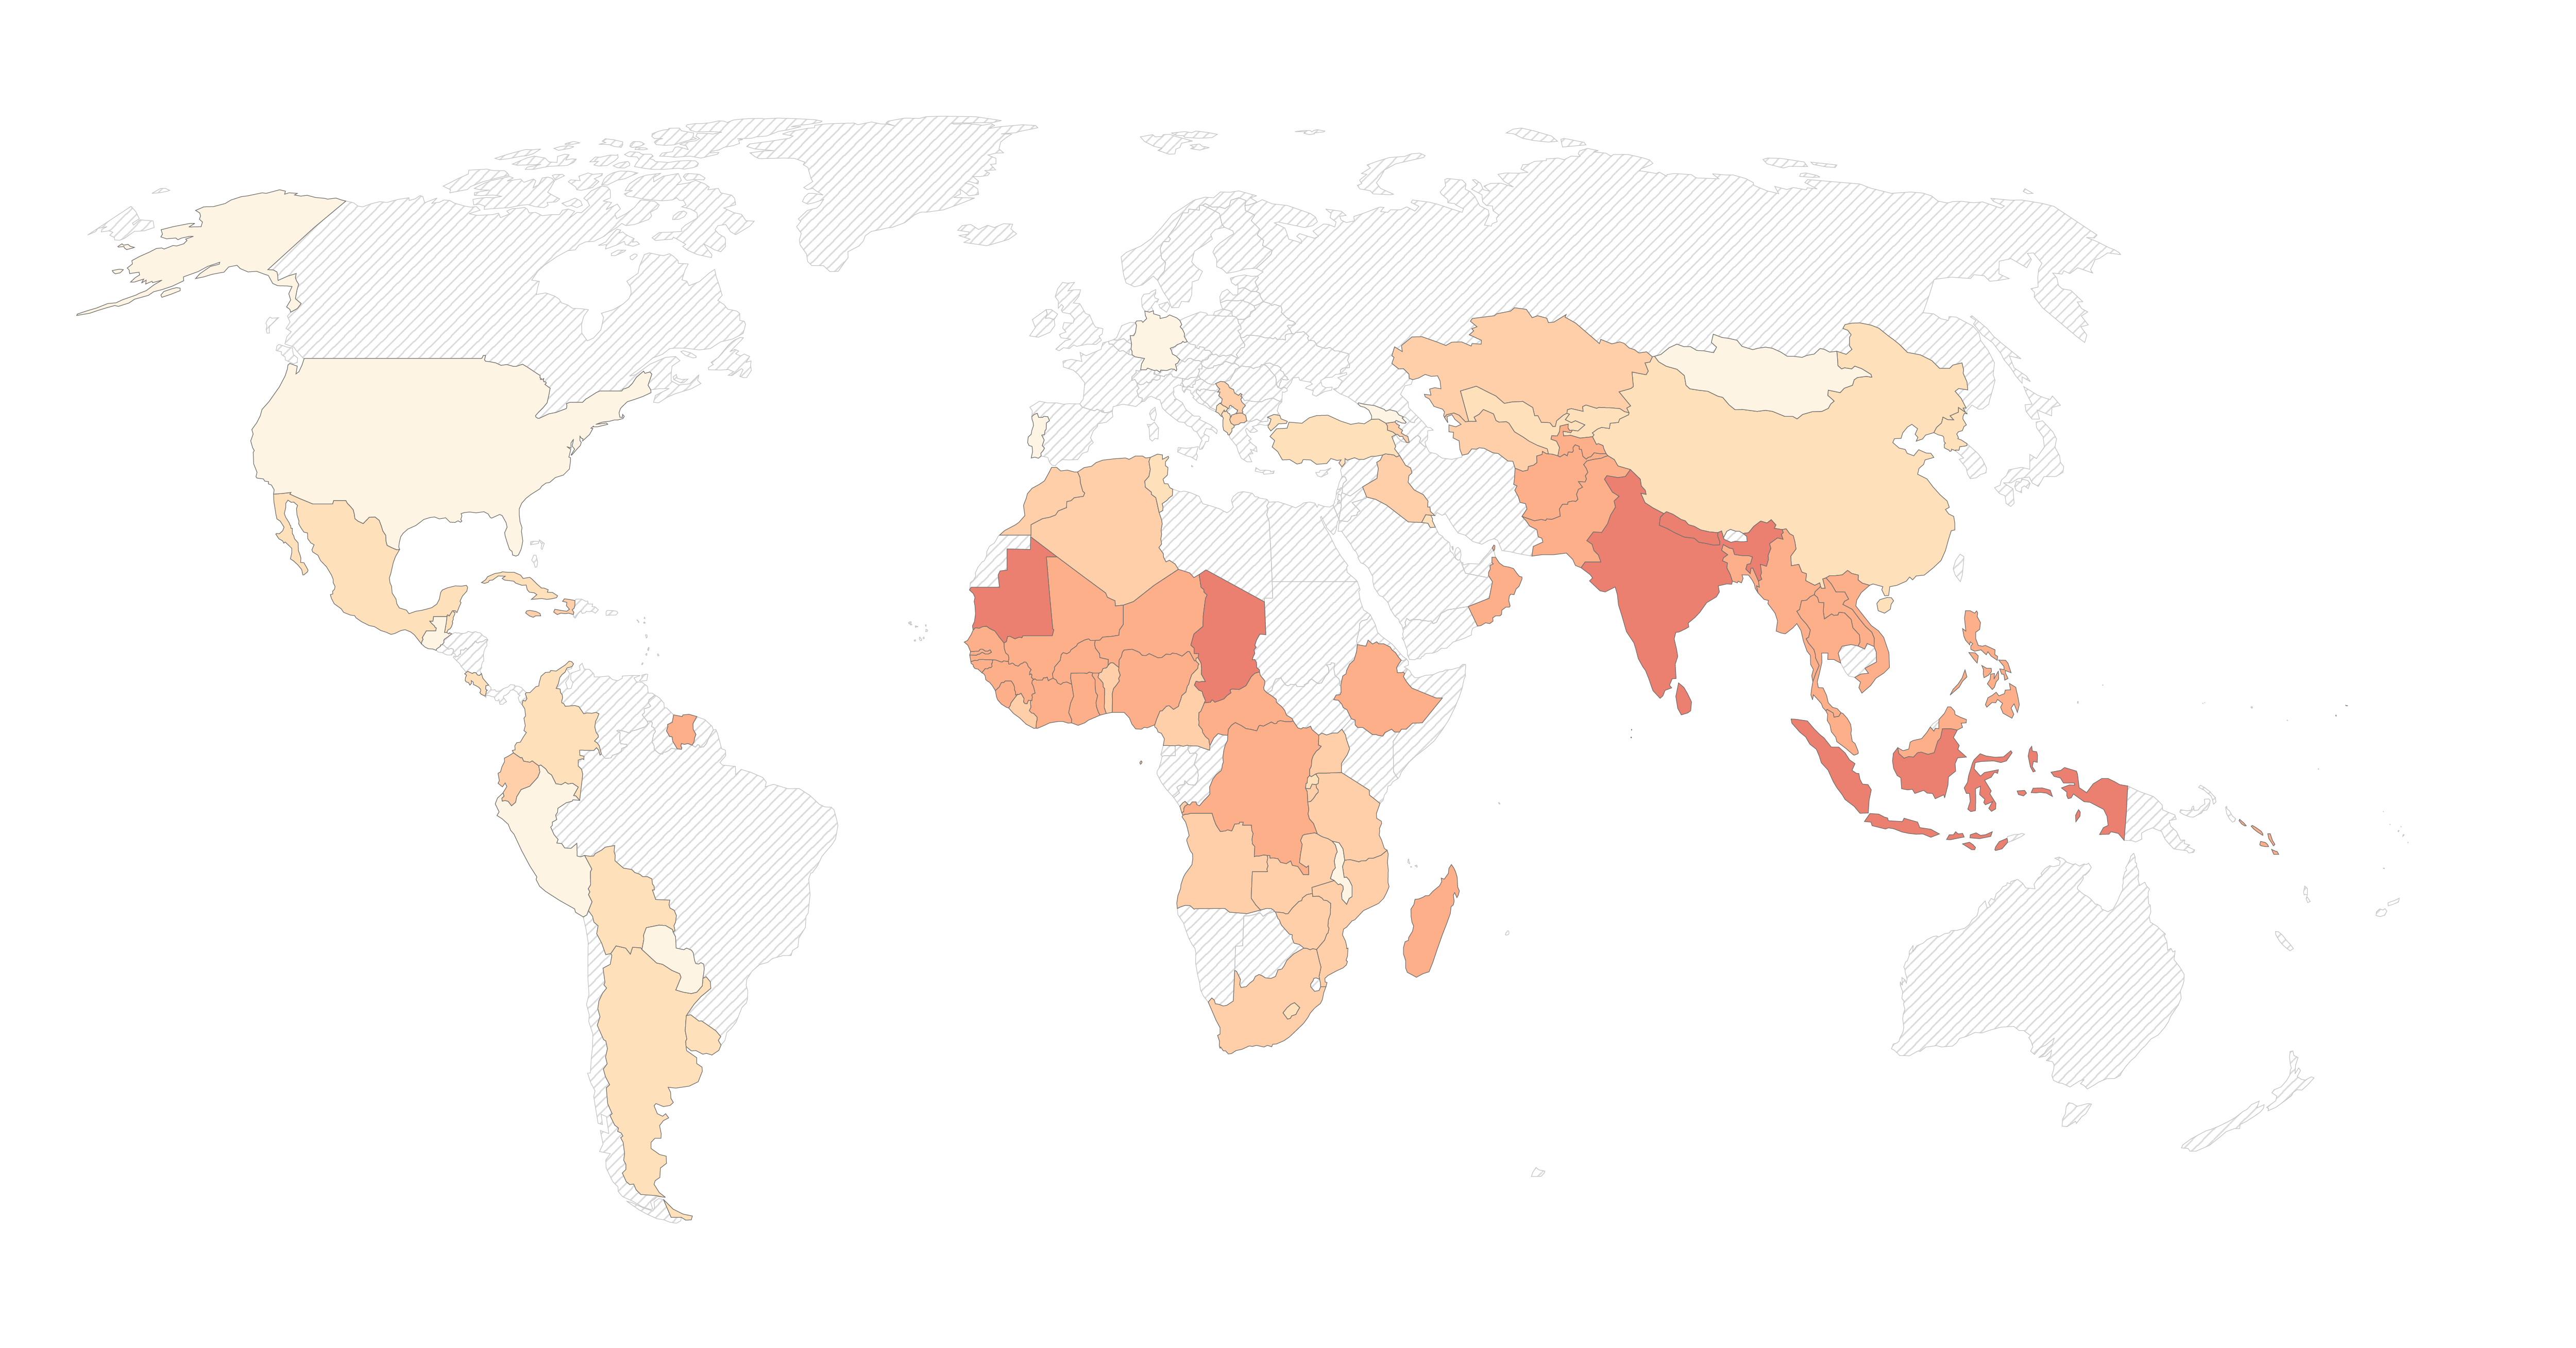
Share of children who are stunted

UNICEF/WHO (via World Bank)

What you should know about this indicator

Share of children who are stunted UNICEF/WHO (via World Bank)
Source
processed by Our World in Data
Last updated
May 29, 2023
Next expected update
May 2024
Date range
1983–2021
Unit
% of children under 5

Frequently Asked Questions

What is stunting?

Stunting is one of the leading measures used to assess childhood malnutrition. It indicates that a child has failed to reach their growth potential as a result of disease, poor health and malnutrition.1

A child is defined as ‘stunted’ if they are too short for their age. This indicates that their growth and development have been hindered.

Stunting is not just an issue during childhood. It affects both physical and cognitive development – impacts that can persist throughout someone’s life. There is some evidence to suggest that ‘catch-up growth’ is possible: that it is possible to reverse some of these impacts if environmental conditions significantly improve. But this is not always the case.

How is stunting measured?

Stunting is measured based on a child’s height relative to their age.

The World Health Organization (WHO) sets out global growth curves – these show the expected trajectory of a child’s growth from birth through to adulthood. Of course, we would not expect everyone to be exactly the same height – there is a range of factors, such as genetics, which influence our height and are not a reflection of poor health or malnutrition. These growth curves therefore span a range of heights.

We see these growth curves for boys and girls in the chart. The median growth curve is shown by the thick line. The ribbons around this median show the ‘acceptable’ range. This range is two standard deviations above and below the median.

A child whose height falls below the bottom of the ribbon – that is, two standard deviations below their expected height for their age – is defined as ‘stunted’.

In a population, the prevalence of stunting is defined as the share of children under five years old that fall two standard deviations below the expected height for their age.

To estimate the prevalence of stunting, researchers draw on household and demographic surveys, which include measurements of childhood growth, alongside official health data from governments that monitor child development.

What are the causes of stunting?

Stunting can occur throughout childhood, but is largely determined by a child’s “first 1,000 days”. This stretches from the period just before conception (meaning the nutritional status of mothers is very important) through to the child’s second birthday. This is when a child experiences its most rapid phase of growth and development.

Stunting occurs when a child does not have sufficient nutrition to grow and develop. This can be caused by a poor diet alone, but is often exacerbated by disease and poor health.

When a child is fighting poor health or disease, its nutritional requirements are often higher – it needs more energy and nutrients to not only grow, but to also fight infection. The absorption of nutrients might also be impacted. For example, if it experiences repeated bouts of diarrheal diseases – which are common in children – its ability to retain nutrients will be severely impacted.

Therefore, to prevent stunting we must ensure mothers have good nutrition and health prior to, and during, pregnancy; a child has access to a sufficient and nutritious diet; has access to clean water, sanitation and hygiene facilities to prevent infection; and has adequate treatment to recover quickly from disease and poor health.

Sources and processing

This data is based on the following sources

Retrieved on
May 29, 2023
Citation
This is the citation of the original data obtained from the source, prior to any processing or adaptation by Our World in Data. To cite data downloaded from this page, please use the suggested citation given in Reuse This Work below.

How we process data at Our World in Data

All data and visualizations on Our World in Data rely on data sourced from one or several original data providers. Preparing this original data involves several processing steps. Depending on the data, this can include standardizing country names and world region definitions, converting units, calculating derived indicators such as per capita measures, as well as adding or adapting metadata such as the name or the description given to an indicator.

At the link below you can find a detailed description of the structure of our data pipeline, including links to all the code used to prepare data across Our World in Data.

Read about our data pipeline

Reuse this work

  • All data produced by third-party providers and made available by Our World in Data are subject to the license terms from the original providers. Our work would not be possible without the data providers we rely on, so we ask you to always cite them appropriately (see below). This is crucial to allow data providers to continue doing their work, enhancing, maintaining and updating valuable data.
  • All data, visualizations, and code produced by Our World in Data are completely open access under the Creative Commons BY license. You have the permission to use, distribute, and reproduce these in any medium, provided the source and authors are credited.

Citations

How to cite this page

To cite this page overall, including any descriptions, FAQs or explanations of the data authored by Our World in Data, please use the following citation:

How to cite this data

In-line citationIf you have limited space (e.g. in data visualizations), you can use this abbreviated in-line citation:

Full citation