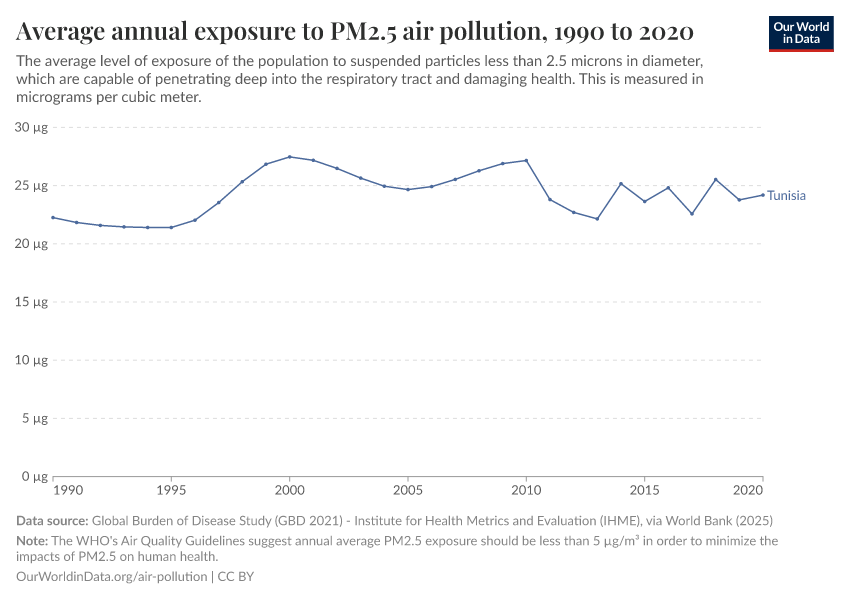
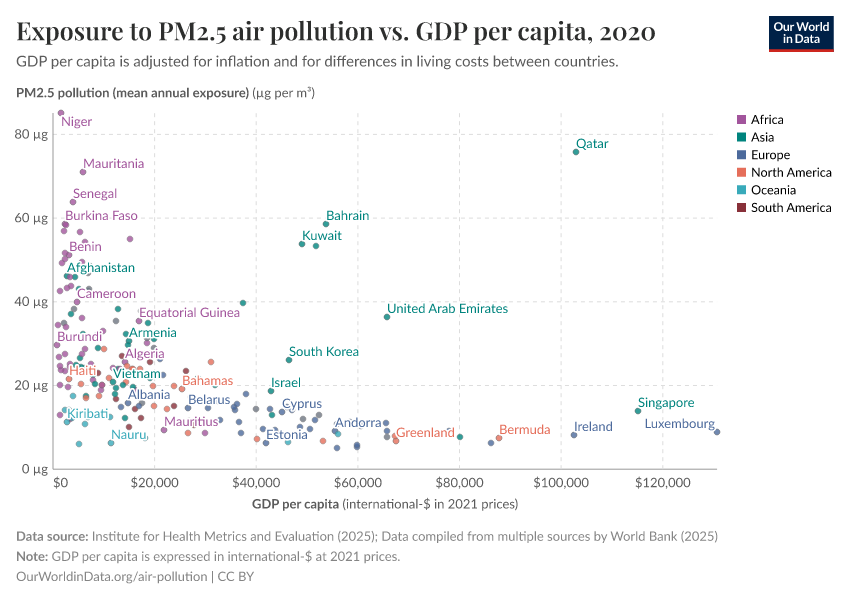
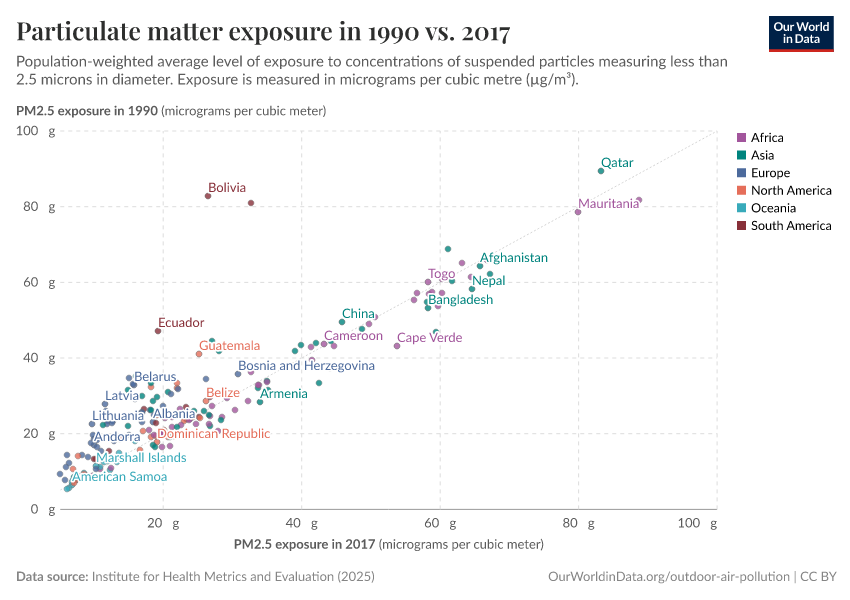
Data

Share of the population exposed to air pollution levels above WHO guidelines

What you should know about this indicator

Percent of population exposed to ambient concentrations of PM2.5 that exceed the WHO guideline value is defined as the portion of a country’s population living in places where mean annual concentrations of PM2.5 are greater than 10 micrograms per cubic meter, the guideline value recommended by the World Health Organization as the lower end of the range of concentrations over which adverse health effects due to PM2.5 exposure have been observed.

Limitations and exceptions: Pollutant concentrations are sensitive to local conditions, and even monitoring sites in the same city may register different levels. Direct monitoring of PM2.5 is still rare in most parts of the world, and measurement protocols and standards are not the same for all countries. These data should be considered only a general indication of air quality, intended to inform cross-country comparisons of the health risks due to particulate matter pollution. The guideline set by the World Health Organization (WHO) for PM2.5 is that annual mean concentrations should not exceed 10 micrograms per cubic meter, representing the lower range over which adverse health effects have been observed. The WHO has also recommended guideline values for emissions of PM2.5 from burning fuels in households.

Statistical concept and methodology: A. van Donkelaar, R.V. Martin, M. Brauer, N.C. Hsu, R.A. Kahn, R.C. Levy, A. Lyapustin, A.M. Sayer, D.M. Winker, "Global Estimates of Fine Particulate Matter using a Combined Geophysical-Statistical Method with Information from Satellites, Models, and Monitors," Environ. Sci. Technol 50, no. 7 (2016): 3762–3772; GBD 2017 Risk Factors Collaborators, "Global, regional, and national comparative risk assessment of 84 behavioural, environmental and occupational, and metabolic risks or clusters of risks for 194 countries and territories, 1990–2017: a systematic analysis for the Global Burden of Disease Study 2017," Lancet 392 (2018): 1923-1994; Shaddick G, Thomas M, Amini H, Broday DM, Cohen A, Frostad J, Green A, Gumy S, Liu Y, Martin RV, Prüss-Üstün A, Simpson D, van Donkelaar A, Brauer M. Data integration for the assessment of population exposure to ambient air pollution for global burden of disease assessment. Environ Sci Technol. 2018 Jun 29. Data provided by Institute for Health Metrics and Evaluation, University of Washington, Seattle. Data on exposure to ambient air pollution are derived from estimates of annual concentrations of very fine particulates produced by the Global Burden of Disease study, an international scientific effort led by the Institute for Health Metrics and Evaluation at the University of Washington. Estimates of annual concentrations are generated by combining data from atmospheric chemistry transport models, satellite observations of aerosols in the atmosphere, and ground-level monitoring of particulates. Overlaying PM2.5 estimates with gridded population data, the percent of a nation's people that lives in areas where PM2.5 concentrations exceed recommended levels is calculated by summing the population for grid cells where PM2.5 concentrations are beyond a threshold value, in this case 10 micrograms per cubic meter, and then dividing by total population.

Source
Multiple sources compiled by World Bank (2024) – processed by Our World in Data
Last updated
May 20, 2024
Next expected update
May 2025
Date range
1990–2017
Unit
% of total

Sources and processing

This data is based on the following sources

The World Development Indicators (WDI) is the primary World Bank collection of development indicators, compiled from officially-recognized international sources. It presents the most current and accurate global development data available, and includes national, regional and global estimates.

Retrieved on
May 20, 2024
Citation
This is the citation of the original data obtained from the source, prior to any processing or adaptation by Our World in Data. To cite data downloaded from this page, please use the suggested citation given in Reuse This Work below.
World Bank's World Development Indicators (WDI).

How we process data at Our World in Data

All data and visualizations on Our World in Data rely on data sourced from one or several original data providers. Preparing this original data involves several processing steps. Depending on the data, this can include standardizing country names and world region definitions, converting units, calculating derived indicators such as per capita measures, as well as adding or adapting metadata such as the name or the description given to an indicator.

At the link below you can find a detailed description of the structure of our data pipeline, including links to all the code used to prepare data across Our World in Data.

Read about our data pipeline

Reuse this work

  • All data produced by third-party providers and made available by Our World in Data are subject to the license terms from the original providers. Our work would not be possible without the data providers we rely on, so we ask you to always cite them appropriately (see below). This is crucial to allow data providers to continue doing their work, enhancing, maintaining and updating valuable data.
  • All data, visualizations, and code produced by Our World in Data are completely open access under the Creative Commons BY license. You have the permission to use, distribute, and reproduce these in any medium, provided the source and authors are credited.

Citations

How to cite this page

To cite this page overall, including any descriptions, FAQs or explanations of the data authored by Our World in Data, please use the following citation:

“Data Page: Share of the population exposed to air pollution levels above WHO guidelines”. Our World in Data (2024). Data adapted from Brauer et al. (2017) via World Bank. Retrieved from https://ourworldindata.org/grapher/share-above-who-pollution-guidelines [online resource]
How to cite this data

In-line citationIf you have limited space (e.g. in data visualizations), you can use this abbreviated in-line citation:

Multiple sources compiled by World Bank (2024) – processed by Our World in Data

Full citation

Multiple sources compiled by World Bank (2024) – processed by Our World in Data. “Share of the population exposed to air pollution levels above WHO guidelines” [dataset]. Brauer et al. (2017) via World Bank, “World Development Indicators” [original data]. Retrieved December 12, 2024 from https://ourworldindata.org/grapher/share-above-who-pollution-guidelines