Data

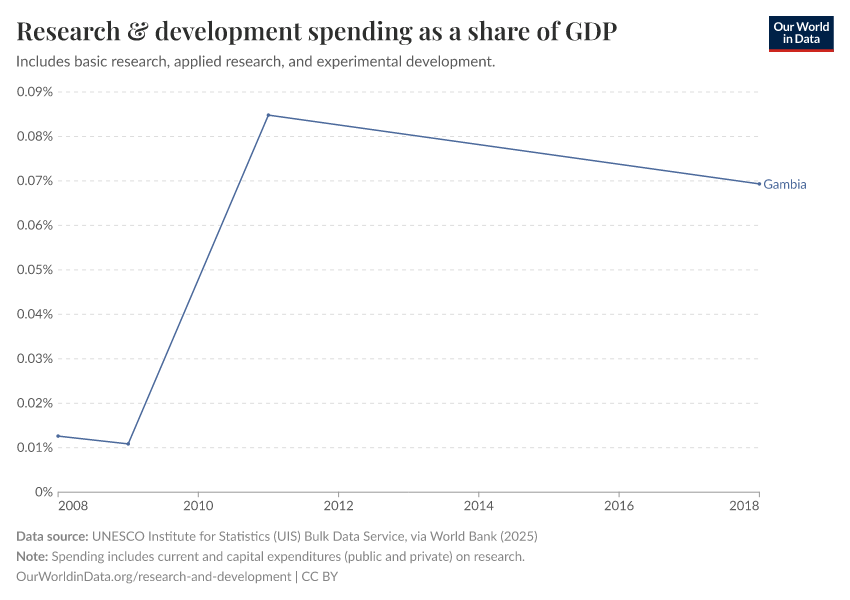
Research & development spending as a share of GDP
What you should know about this indicator

Gross domestic expenditures on research and development (R&D), expressed as a percent of GDP. They include both capital and current expenditures in the four main sectors: Business enterprise, Government, Higher education and Private non-profit. R&D covers basic research, applied research, and experimental development.

Limitations and exceptions: Estimates of the resources allocated to R&D are affected by national characteristics such as the periodicity and coverage of national R&D surveys across institutional sectors and industries; and the use of different sampling and estimation methods. R&D typically involves a few large performers, hence R&D surveys use various techniques to maintain up-to-date registers of known performers, while attempting to identify new or occasional performers.

R&D totals from SNA accounts may differ from these estimates, due in part to the different treatments of software R&D in the totals.

Statistical concept and methodology: The gross domestic expenditure on R&D indicator consists of the total expenditure (current and capital) on R&D by all resident companies, research institutes, university and government laboratories, etc. It excludes R&D expenditures financed by domestic firms but performed abroad.

The OECD's Frascati Manual defines research and experimental development as "creative work undertaken on a systemic basis in order to increase the stock of knowledge, including knowledge of man, culture and society, and the use of this stock of knowledge to devise new applications." R&D covers basic research, applied research, and experimental development.

(1) Basic research - Basic research is experimental or theoretical work undertaken primarily to acquire new knowledge of the underlying foundation of phenomena and observable facts, without any particular application or use in view

(2) Applied research - Applied research is also original investigation undertaken in order to acquire new knowledge; it is, however, directed primarily towards a specific practical aim or objective.

(3) Experimental development - Experimental development is systematic work, drawing on existing knowledge gained from research and/or practical experience, which is directed to producing new materials, products or devices, to installing new processes, systems and services, or to improving substantially those already produced or installed.

The fields of science and technology used to classify R&D according to the Revised Fields of Science and Technology Classification are:

  1. Natural sciences;
  2. Engineering and technology;
  3. Medical and health sciences;
  4. Agricultural sciences;
  5. Social sciences;
  6. Humanities and the arts.

The data are obtained through statistical surveys which are regularly conducted at national level covering R&D performing entities in the private and public sectors.

Source
Multiple sources compiled by World Bank (2024) – processed by Our World in Data
Last updated
May 20, 2024
Next expected update
May 2025
Date range
1996–2021
Unit
% of GDP

Sources and processing

This data is based on the following sources

The World Development Indicators (WDI) is the primary World Bank collection of development indicators, compiled from officially-recognized international sources. It presents the most current and accurate global development data available, and includes national, regional and global estimates.

Retrieved on
May 20, 2024
Citation
This is the citation of the original data obtained from the source, prior to any processing or adaptation by Our World in Data. To cite data downloaded from this page, please use the suggested citation given in Reuse This Work below.
World Bank's World Development Indicators (WDI).

How we process data at Our World in Data

All data and visualizations on Our World in Data rely on data sourced from one or several original data providers. Preparing this original data involves several processing steps. Depending on the data, this can include standardizing country names and world region definitions, converting units, calculating derived indicators such as per capita measures, as well as adding or adapting metadata such as the name or the description given to an indicator.

At the link below you can find a detailed description of the structure of our data pipeline, including links to all the code used to prepare data across Our World in Data.

Read about our data pipeline

Reuse this work

  • All data produced by third-party providers and made available by Our World in Data are subject to the license terms from the original providers. Our work would not be possible without the data providers we rely on, so we ask you to always cite them appropriately (see below). This is crucial to allow data providers to continue doing their work, enhancing, maintaining and updating valuable data.
  • All data, visualizations, and code produced by Our World in Data are completely open access under the Creative Commons BY license. You have the permission to use, distribute, and reproduce these in any medium, provided the source and authors are credited.

Citations

How to cite this page

To cite this page overall, including any descriptions, FAQs or explanations of the data authored by Our World in Data, please use the following citation:

“Data Page: Research & development spending as a share of GDP”. Our World in Data (2024). Data adapted from UNESCO Institute for Statistics. Retrieved from https://ourworldindata.org/grapher/research-spending-gdp [online resource]
How to cite this data

In-line citationIf you have limited space (e.g. in data visualizations), you can use this abbreviated in-line citation:

Multiple sources compiled by World Bank (2024) – processed by Our World in Data

Full citation

Multiple sources compiled by World Bank (2024) – processed by Our World in Data. “Research & development spending as a share of GDP” [dataset]. UNESCO Institute for Statistics, “World Development Indicators” [original data]. Retrieved November 23, 2024 from https://ourworldindata.org/grapher/research-spending-gdp