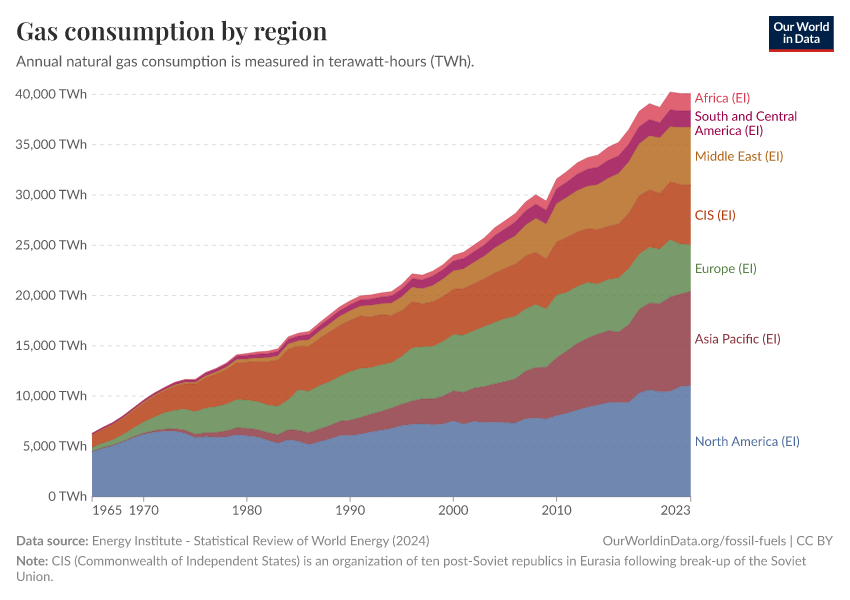
Gas consumption
What you should know about this indicator
Excludes natural gas converted to liquid fuels but includes derivatives of coal as well as natural gas consumed in Gas-to-Liquids transformation. The difference between the world consumption figures and the world production statistics is due to variations in stocks at storage facilities and liquefaction plants, together with unavoidable disparities in the definition, measurement or conversion of gas supply and demand data.
Related research and writing
What you should know about this indicator
Excludes natural gas converted to liquid fuels but includes derivatives of coal as well as natural gas consumed in Gas-to-Liquids transformation. The difference between the world consumption figures and the world production statistics is due to variations in stocks at storage facilities and liquefaction plants, together with unavoidable disparities in the definition, measurement or conversion of gas supply and demand data.
Sources and processing
This data is based on the following sources
How we process data at Our World in Data
All data and visualizations on Our World in Data rely on data sourced from one or several original data providers. Preparing this original data involves several processing steps. Depending on the data, this can include standardizing country names and world region definitions, converting units, calculating derived indicators such as per capita measures, as well as adding or adapting metadata such as the name or the description given to an indicator.
At the link below you can find a detailed description of the structure of our data pipeline, including links to all the code used to prepare data across Our World in Data.
Reuse this work
- All data produced by third-party providers and made available by Our World in Data are subject to the license terms from the original providers. Our work would not be possible without the data providers we rely on, so we ask you to always cite them appropriately (see below). This is crucial to allow data providers to continue doing their work, enhancing, maintaining and updating valuable data.
- All data, visualizations, and code produced by Our World in Data are completely open access under the Creative Commons BY license. You have the permission to use, distribute, and reproduce these in any medium, provided the source and authors are credited.
Citations
How to cite this page
To cite this page overall, including any descriptions, FAQs or explanations of the data authored by Our World in Data, please use the following citation:
“Data Page: Gas consumption”, part of the following publication: Hannah Ritchie, Pablo Rosado, and Max Roser (2023) - “Energy”. Data adapted from Energy Institute. Retrieved from https://archive.ourworldindata.org/20250909-093708/grapher/gas-consumption-by-country.html [online resource] (archived on September 9, 2025).How to cite this data
In-line citationIf you have limited space (e.g. in data visualizations), you can use this abbreviated in-line citation:
Energy Institute - Statistical Review of World Energy (2025) – with major processing by Our World in DataFull citation
Energy Institute - Statistical Review of World Energy (2025) – with major processing by Our World in Data. “Gas consumption” [dataset]. Energy Institute, “Statistical Review of World Energy” [original data]. Retrieved December 29, 2025 from https://archive.ourworldindata.org/20250909-093708/grapher/gas-consumption-by-country.html (archived on September 9, 2025).
