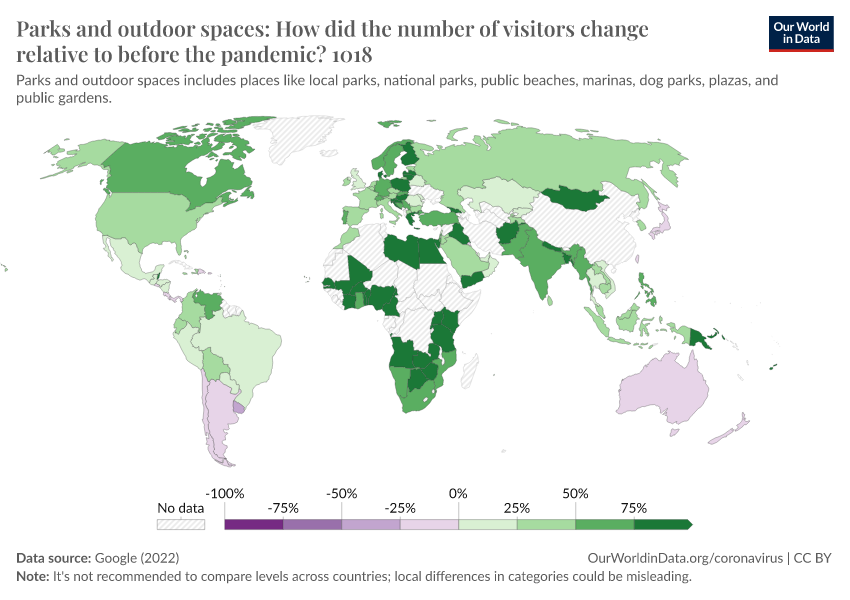
Parks and outdoor spaces: How did the number of visitors change relative to before the pandemic?

What you should know about this indicator
- These datasets show how visits and length of stay at different places change compared to a baseline. Google calculates these changes using the same kind of aggregated and anonymized data used to show popular times for places in Google Maps.
- Changes for each day are compared to a baseline value for that day of the week:
- The baseline is the median value, for the corresponding day of the week, during the 5-week period Jan 3–Feb 6, 2020.
- The datasets show trends over several months with the most recent data representing approximately 2-3 days ago—this is how long it takes to produce the datasets.
- What data is included in the calculation depends on user settings, connectivity, and whether it meets our privacy threshold. When the data doesn't meet quality and privacy thresholds, you might see empty fields for certain places and dates.
- Google includes categories that are useful to social distancing efforts as well as access to essential services.
- Google calculates these insights based on data from users who have opted-in to Location History for their Google Account, so the data represents a sample of our users. As with all samples, this may or may not represent the exact behavior of a wider population.
Related research and writing
What you should know about this indicator
- These datasets show how visits and length of stay at different places change compared to a baseline. Google calculates these changes using the same kind of aggregated and anonymized data used to show popular times for places in Google Maps.
- Changes for each day are compared to a baseline value for that day of the week:
- The baseline is the median value, for the corresponding day of the week, during the 5-week period Jan 3–Feb 6, 2020.
- The datasets show trends over several months with the most recent data representing approximately 2-3 days ago—this is how long it takes to produce the datasets.
- What data is included in the calculation depends on user settings, connectivity, and whether it meets our privacy threshold. When the data doesn't meet quality and privacy thresholds, you might see empty fields for certain places and dates.
- Google includes categories that are useful to social distancing efforts as well as access to essential services.
- Google calculates these insights based on data from users who have opted-in to Location History for their Google Account, so the data represents a sample of our users. As with all samples, this may or may not represent the exact behavior of a wider population.
Sources and processing
This data is based on the following sources
How we process data at Our World in Data
All data and visualizations on Our World in Data rely on data sourced from one or several original data providers. Preparing this original data involves several processing steps. Depending on the data, this can include standardizing country names and world region definitions, converting units, calculating derived indicators such as per capita measures, as well as adding or adapting metadata such as the name or the description given to an indicator.
At the link below you can find a detailed description of the structure of our data pipeline, including links to all the code used to prepare data across Our World in Data.
Notes on our processing step for this indicator
This indicator has been smoothed by averaging its values with a centered 7-day rolling window.
Reuse this work
- All data produced by third-party providers and made available by Our World in Data are subject to the license terms from the original providers. Our work would not be possible without the data providers we rely on, so we ask you to always cite them appropriately (see below). This is crucial to allow data providers to continue doing their work, enhancing, maintaining and updating valuable data.
- All data, visualizations, and code produced by Our World in Data are completely open access under the Creative Commons BY license. You have the permission to use, distribute, and reproduce these in any medium, provided the source and authors are credited.
Citations
How to cite this page
To cite this page overall, including any descriptions, FAQs or explanations of the data authored by Our World in Data, please use the following citation:
“Data Page: Parks and outdoor spaces: How did the number of visitors change relative to before the pandemic?”, part of the following publication: Edouard Mathieu, Hannah Ritchie, Lucas Rodés-Guirao, Cameron Appel, Daniel Gavrilov, Charlie Giattino, Joe Hasell, Bobbie Macdonald, Saloni Dattani, Diana Beltekian, Esteban Ortiz-Ospina, and Max Roser (2020) - “COVID-19 Pandemic”. Data adapted from Google. Retrieved from https://archive.ourworldindata.org/20250909-093708/grapher/change-visitors-parks-covid.html [online resource] (archived on September 9, 2025).How to cite this data
In-line citationIf you have limited space (e.g. in data visualizations), you can use this abbreviated in-line citation:
Google (2022) – with minor processing by Our World in DataFull citation
Google (2022) – with minor processing by Our World in Data. “Parks and outdoor spaces: How did the number of visitors change relative to before the pandemic?” [dataset]. Google, “COVID-19, Community Mobility Reports” [original data]. Retrieved February 7, 2026 from https://archive.ourworldindata.org/20250909-093708/grapher/change-visitors-parks-covid.html (archived on September 9, 2025).