What’s the difference between direct and substituted primary energy?
Understanding the breakdown of our energy systems – how much energy we get from coal, oil or gas, how much from nuclear, solar or wind – is crucial. It lets us compare energy mixes across the world and track progress on decarbonization.
But summarizing global energy with just one metric is not simple. Researchers used a range of measures that tell us different things. There are four different measures, which capture the transformations and losses that occur across the energy chain: primary, secondary, final, or useful energy. I write about these in another article, and summarize them in the chart below.
But a further problem is that energy sources are often reported in commodity markets and some of the most commonly-used datasets using different metrics.
In this article I focus on various ways in which ‘primary energy’ is measured. I explain how different energy sources are quantified in these datasets, and what adjustments are made to make them more comparable.
Fossil fuel energy is measured differently from renewable electricity
Energy from fossil fuels – coal, oil and gas – are usually measured as primary energy. That is, the amount of energy that’s generated when they are burned in their raw form. For coal, it’s the total amount of energy you get when you burn it.
But, a large amount of this raw energy is wasted as heat. A typical coal plant in the US has an efficiency of 33%.1 Only one-third generates electricity, and the other two-thirds is wasted as heat. You need to burn three units of coal to get one unit of electricity.
Gas electricity is slightly better, with an efficiency of around 45%. Put two units of gas energy in, and you get almost one unit of electricity out.
In popular datasets, such as the Statistical Review of World Energy, published by the Energy Institute (it was formerly published by BP), coal and gas are reported in their primary energy terms – as the fuels going into the power plant.
But this is not how renewable electricity – such as solar and wind is recorded. It’s reported in terms of its electricity output.
Think about what this means. We’re comparing the amount of energy generated by fossil fuels with all of the wasted heat, to the amount generated by renewables without this wastage. If you were to replace the electricity from coal and gas with renewables, the energy requirements would be much lower.
The ‘substitution’ primary energy method
To ‘correct’ for these different methods of accounting, researchers can apply the ‘substitution method’. This tries to adjust non-fossil energy sources to the inputs that would be needed if it was generated from fossil fuels. It assumes that wind and solar electricity is as inefficient as coal or gas.
This adjustment is fairly crude. Non-fossil electricity generation is divided by a ‘thermal efficiency factor’, which is the average efficiency of fossil electricity. In the chart, we see the factor that the Energy Institute applies. This factor has changed over time due to changes in the composition of the fossil fuel mix (the split between coal and gas), and efficiency improvements in power plants over time.

Let’s say that a country produces 100 terawatt-hours (TWh) of electricity from solar, and the thermal efficiency factor is 0.4. To get the ‘primary energy equivalents’ we divide 100 TWh by 0.4. That’s 250 TWh.
What this means is that if this electricity was produced by fossil fuels, we’d need 250 TWh of energy in to get 100 TWh of electricity out.
In the substitution method, non-fossil electricity sources are divided by this efficiency factor.
The same is done for nuclear. In reality, nuclear does experience thermal losses in a power plant, just like fossil fuels. It has a thermal efficiency ranging from around 33% to 40%. But since it’s reported in terms of electricity output, we need to do this adjustment to calculate its equivalent input value.
Since we’re adjusting renewables upwards – to assume that they’re more inefficient than they are – primary energy measured by the ‘substitution method’ overstates the amount of energy that’s produced.
The difference between ‘substitution’ and ‘direct’ primary energy
How we measure primary energy matters for the comparisons of energy sources.
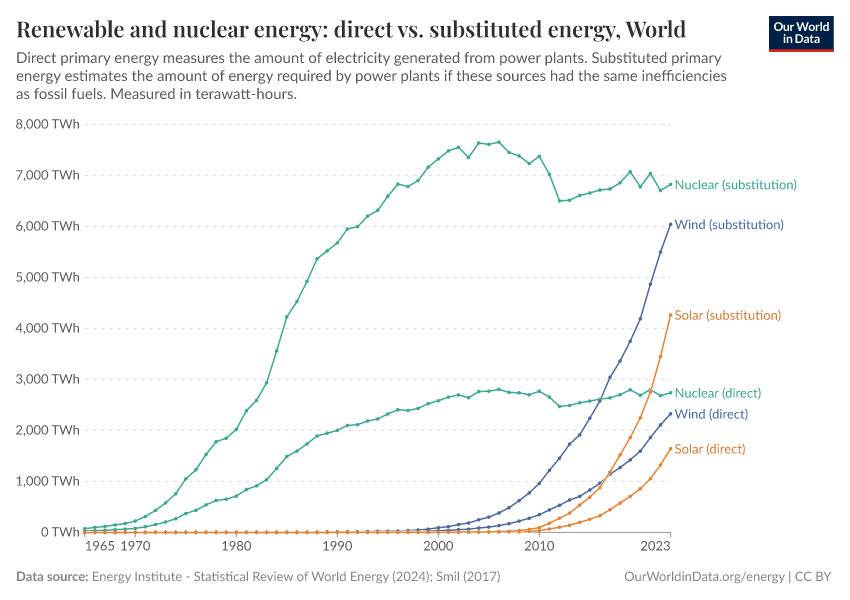
One way to look at this is to see the production of renewables and nuclear changes based on the ‘direct’ and ‘substitution’ method. This is shown in the chart below. You can see that ‘substituted energy’ is always higher than ‘direct energy’.
Again, to be clear: nuclear energy also has inefficiencies in thermal generation in a power plant. But national statistics tend to report it as electricity outputs, so we need to apply the same conversion factors as we do for renewables.

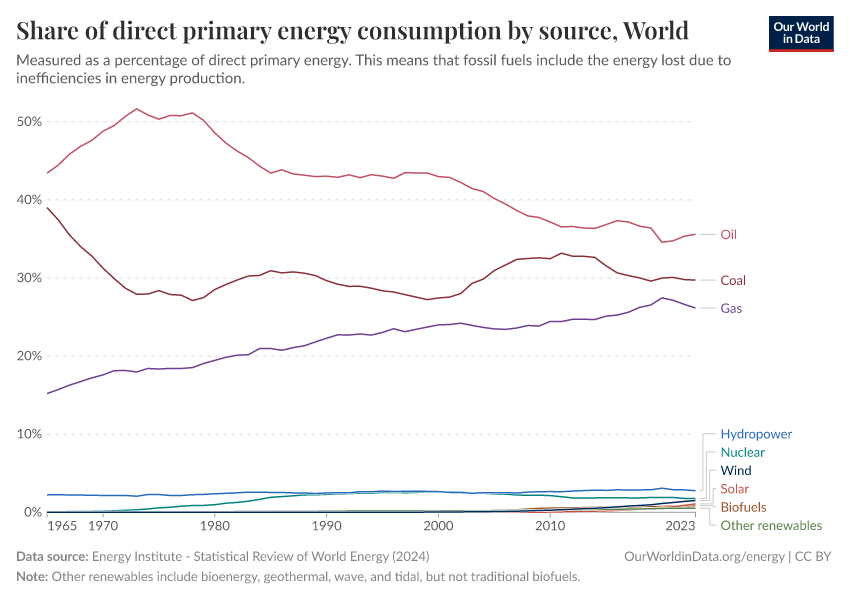
When we compare these energy sources to fossil fuels in direct primary energy terms, we’re comparing inefficient fossil fuel inputs to renewable energy sources without this inefficiency. That makes it look like solar and wind are making a small contribution to energy demand.
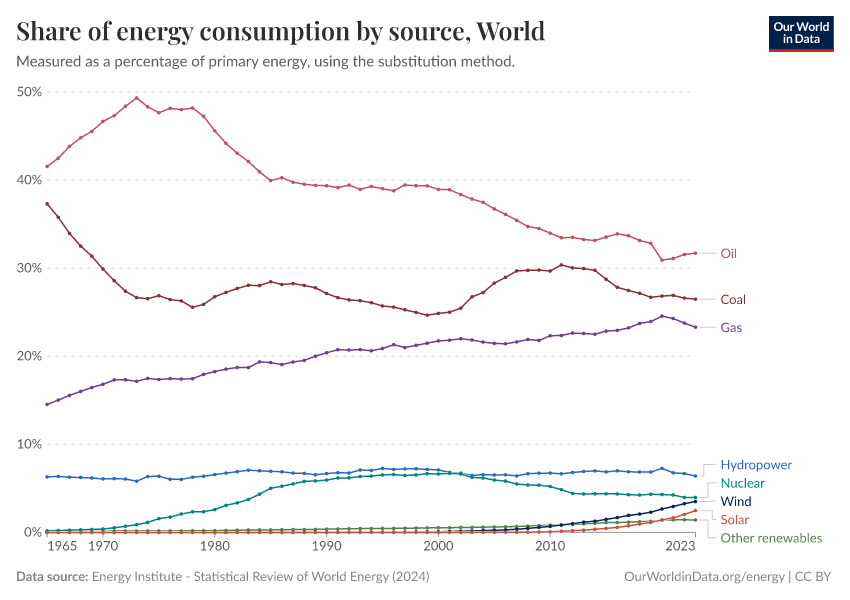
When we adjust renewables via the substitution method, their share in the energy mix increases. We see this in the two charts below.


In general, the ‘substitution method’ gives us a better reflection of the contribution of different sources to the energy mix. That’s why researchers often apply it.
However, this still fails to account for many other inefficiencies that are removed when we decarbonize our energy systems. For example, electric vehicles are around four times as efficient as petrol or diesel cars. Similarly, electric heat pumps significantly reduce gas demands.
These energy reductions are not captured in primary energy metrics. To understand them we need to look at final and useful energy demand. I cover this in a related article here.
Update
This article was first published in November 2021, and updated in October 2023.
Endnotes
This efficiency also depends on the age and type of coal or gas plant. Newer plants can achieve slightly higher efficiency.
Cite this work
Our articles and data visualizations rely on work from many different people and organizations. When citing this article, please also cite the underlying data sources. This article can be cited as:
Hannah Ritchie and Pablo Rosado (2021) - “What’s the difference between direct and substituted primary energy?” Published online at OurWorldinData.org. Retrieved from: 'https://archive.ourworldindata.org/20260119-070102/energy-substitution-method.html' [Online Resource] (archived on January 19, 2026).BibTeX citation
@article{owid-energy-substitution-method,
    author = {Hannah Ritchie and Pablo Rosado},
    title = {What’s the difference between direct and substituted primary energy?},
    journal = {Our World in Data},
    year = {2021},
    note = {https://archive.ourworldindata.org/20260119-070102/energy-substitution-method.html}
}
Reuse this work freely
All visualizations, data, and code produced by Our World in Data are completely open access under the Creative Commons BY license. You have the permission to use, distribute, and reproduce these in any medium, provided the source and authors are credited.
The data produced by third parties and made available by Our World in Data is subject to the license terms from the original third-party authors. We will always indicate the original source of the data in our documentation, so you should always check the license of any such third-party data before use and redistribution.
All of our charts can be embedded in any site.