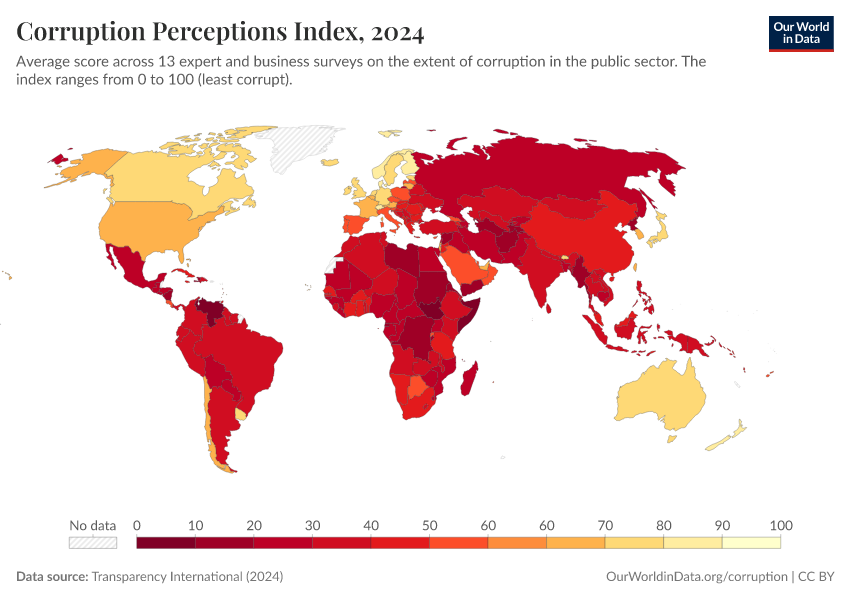
Corruption Perceptions Index (CPI)

What you should know about this indicator
- The Corruption Perceptions Index (CPI) ranks countries and territories based on the perceived level of public sector corruption, as judged by experts and business leaders.
- Depending on the country, it combines data up to 13 independent sources, including expert assessments and business surveys from trusted institutions.
- Each source is converted to a scale from 0 to 100, where 0 means very corrupt and 100 means very clean.
- A country’s CPI score is the simple average of the available sources for that year.
- The method has stayed the same since 2012, so scores can be compared over time.
- The CPI includes a 90% confidence interval (margin of error) to reflect differences between sources and possible inconsistencies.
- The CPI does not measure corruption directly. It measures perceptions, because there are no fully objective national measures of corruption.
Sources and processing
This data is based on the following sources
How we process data at Our World in Data
All data and visualizations on Our World in Data rely on data sourced from one or several original data providers. Preparing this original data involves several processing steps. Depending on the data, this can include standardizing country names and world region definitions, converting units, calculating derived indicators such as per capita measures, as well as adding or adapting metadata such as the name or the description given to an indicator.
At the link below you can find a detailed description of the structure of our data pipeline, including links to all the code used to prepare data across Our World in Data.
Reuse this work
- All data produced by third-party providers and made available by Our World in Data are subject to the license terms from the original providers. Our work would not be possible without the data providers we rely on, so we ask you to always cite them appropriately (see below). This is crucial to allow data providers to continue doing their work, enhancing, maintaining and updating valuable data.
- All data, visualizations, and code produced by Our World in Data are completely open access under the Creative Commons BY license. You have the permission to use, distribute, and reproduce these in any medium, provided the source and authors are credited.
Citations
How to cite this page
To cite this page overall, including any descriptions, FAQs or explanations of the data authored by Our World in Data, please use the following citation:
“Data Page: Corruption Perceptions Index (CPI)”, part of the following publication: Bastian Herre, Veronika Samborska, and Esteban Ortiz-Ospina (2016) - “Corruption”. Data adapted from Transparency International. Retrieved from https://archive.ourworldindata.org/20251209-133038/grapher/ti-corruption-perception-index.html [online resource] (archived on December 9, 2025).How to cite this data
In-line citationIf you have limited space (e.g. in data visualizations), you can use this abbreviated in-line citation:
Transparency International (2024) – with minor processing by Our World in DataFull citation
Transparency International (2024) – with minor processing by Our World in Data. “Corruption Perceptions Index (CPI)” [dataset]. Transparency International, “Corruption Perceptions Index” [original data]. Retrieved December 23, 2025 from https://archive.ourworldindata.org/20251209-133038/grapher/ti-corruption-perception-index.html (archived on December 9, 2025).