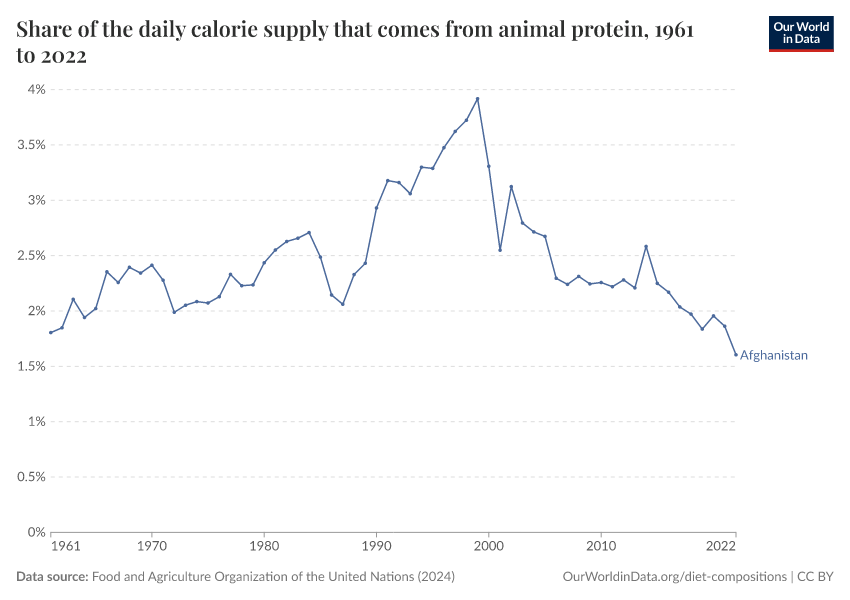
Share of the daily calorie supply that comes from animal protein

About this data
About this data
Sources and processing
This data is based on the following sources
How we process data at Our World in Data
All data and visualizations on Our World in Data rely on data sourced from one or several original data providers. Preparing this original data involves several processing steps. Depending on the data, this can include standardizing country names and world region definitions, converting units, calculating derived indicators such as per capita measures, as well as adding or adapting metadata such as the name or the description given to an indicator.
At the link below you can find a detailed description of the structure of our data pipeline, including links to all the code used to prepare data across Our World in Data.
Notes on our processing step for this indicator
- The FAO provide annual figures from 1961 by country on daily caloric supply, fat supply (in grams), and protein supply (in grams). To calculate the daily per capita supply of carbohydrates, we assume an energy density by macronutrient of 4 kcal per gram of both protein and carbohydrate and 9 kcal per gram of fat (based on established nutritional guidelines reported by the FAO). The daily supply of carbohydrates is therefore calculated as:
((Daily supply of kcal)-(Daily supply of protein * 4 + Daily supply of fat * 9)) / 4
-
The quantity of calories from each macronutrient is then calculated based on the energy density figures given above (e.g. calories from protein is calculated by multiplying the daily supply of protein in grams by 4).
-
For an explanation of these conversion factors, see "Chapter 3: Calculation Of The Energy Content Of Foods - Energy Conversion Factors", available at: http://www.fao.org/docrep/006/Y5022E/y5022e04.htm
-
The share of calories derived from each macronutrient is then calculated by dividing the number of calories derived from a given macronutrient by the total daily caloric supply.
-
Protein of animal origin includes protein supplied in the form of all meat commodities, eggs and dairy products, and fish & seafood.
Reuse this work
- All data produced by third-party providers and made available by Our World in Data are subject to the license terms from the original providers. Our work would not be possible without the data providers we rely on, so we ask you to always cite them appropriately (see below). This is crucial to allow data providers to continue doing their work, enhancing, maintaining and updating valuable data.
- All data, visualizations, and code produced by Our World in Data are completely open access under the Creative Commons BY license. You have the permission to use, distribute, and reproduce these in any medium, provided the source and authors are credited.
Citations
How to cite this page
To cite this page overall, including any descriptions, FAQs or explanations of the data authored by Our World in Data, please use the following citation:
“Data Page: Share of the daily calorie supply that comes from animal protein”, part of the following publication: Hannah Ritchie, Pablo Rosado, and Max Roser (2023) - “Agricultural Production”. Data adapted from Food and Agriculture Organization of the United Nations. Retrieved from https://archive.ourworldindata.org/20251014-163147/grapher/share-of-the-daily-calorie-supply-that-comes-from-animal-protein.html [online resource] (archived on October 14, 2025).How to cite this data
In-line citationIf you have limited space (e.g. in data visualizations), you can use this abbreviated in-line citation:
Food and Agriculture Organization of the United Nations (2024) – with major processing by Our World in DataFull citation
Food and Agriculture Organization of the United Nations (2024) – with major processing by Our World in Data. “Share of the daily calorie supply that comes from animal protein – FAO” [dataset]. Food and Agriculture Organization of the United Nations, “Food Balances: Food Balances (-2013, old methodology and population)”; Food and Agriculture Organization of the United Nations, “Food Balances: Food Balances (2010-)” [original data]. Retrieved January 13, 2026 from https://archive.ourworldindata.org/20251014-163147/grapher/share-of-the-daily-calorie-supply-that-comes-from-animal-protein.html (archived on October 14, 2025).