Data

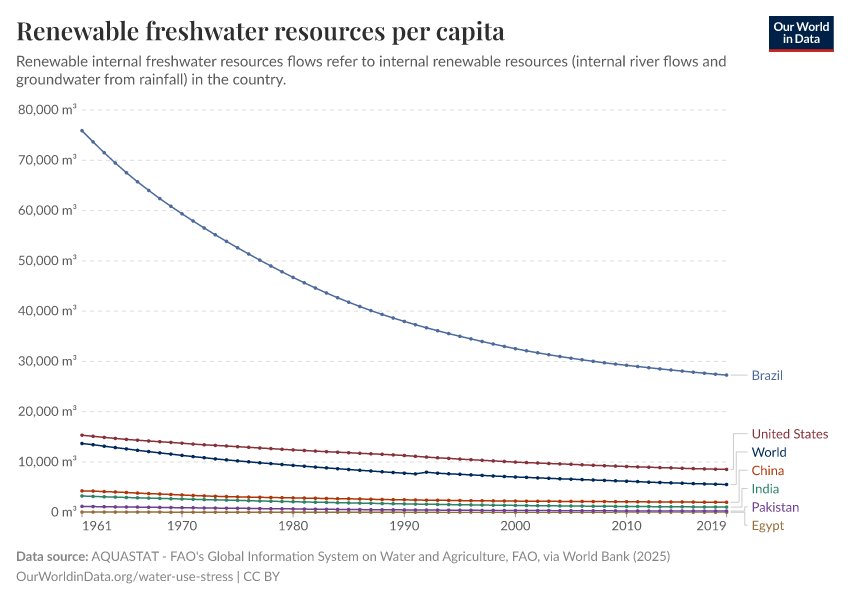
Renewable freshwater resources per capita
What you should know about this indicator

Renewable internal freshwater resources flows refer to internal renewable resources (internal river flows and groundwater from rainfall) in the country. Renewable internal freshwater resources per capita are calculated using the World Bank's population estimates.

Limitations and exceptions: A common perception is that most of the available freshwater resources are visible (on the surfaces of lakes, reservoirs and rivers). However, this visible water represents only a tiny fraction of global freshwater resources, as most of it is stored in aquifers, with the largest stocks stored in solid form in the Antarctic and in Greenland's ice cap.

The data on freshwater resources are based on estimates of runoff into rivers and recharge of groundwater. These estimates are based on different sources and refer to different years, so cross-country comparisons should be made with caution. Because the data are collected intermittently, they may hide significant variations in total renewable water resources from year to year. The data also fail to distinguish between seasonal and geographic variations in water availability within countries. Data for small countries and countries in arid and semiarid zones are less reliable than those for larger countries and countries with greater rainfall.

Caution should also be used in comparing data on annual freshwater withdrawals, which are subject to variations in collection and estimation methods. In addition, inflows and outflows are estimated at different times and at different levels of quality and precision, requiring caution in interpreting the data, particularly for water-short countries, notably in the Middle East and North Africa.

The data are based on surveys and estimates provided by governments to the Joint Monitoring Programme of the World Health Organization (WHO) and the United Nations Children's Fund (UNICEF). The coverage rates are based on information from service users on actual household use rather than on information from service providers, which may include nonfunctioning systems.

Statistical concept and methodology: Renewable water resources (internal and external) include average annual flow of rivers and recharge of aquifers generated from endogenous precipitation, and those water resources that are not generated in the country, such as inflows from upstream countries (groundwater and surface water), and part of the water of border lakes and/or rivers. Non-renewable water includes groundwater bodies (deep aquifers) that have a negligible rate of recharge on the human time-scale. While renewable water resources are expressed in flows, non-renewable water resources have to be expressed in quantity (stock). Runoff from glaciers where the mass balance is negative is considered non-renewable. Renewable internal freshwater resources per capita are calculated using the World Bank's population estimates. The unit of calculation is m3/year per inhabitant. Internal renewable freshwater resources per capita are calculated using the World Bank's population estimates.

Total actual renewable water resources correspond to the maximum theoretical yearly amount of water actually available for a country at a given moment. The unit of calculation is km3/year or 109 m3/year. Calculation Criteria is [Water resources: total renewable (actual)] = [Surface water: total renewable (actual)] + [Groundwater: total renewable (actual)] - [Overlap between surface water and groundwater].*

Fresh water is naturally occurring water on the Earth's surface. It is a renewable but limited natural resource. Fresh water can only be renewed through the process of the water cycle, where water from seas, lakes, forests, land, rivers, and dams evaporates, forms clouds, and returns as precipitation. However, if more fresh water is consumed through human activities than is restored by nature, the result is that the quantity of fresh water available in lakes, rivers, dams and underground waters can be reduced which can cause serious damage to the surrounding environment.

Source
Multiple sources compiled by World Bank (2024) – processed by Our World in Data
Last updated
May 20, 2024
Next expected update
May 2025
Date range
1961–2020
Unit
cubic meters

Sources and processing

This data is based on the following sources

The World Development Indicators (WDI) is the primary World Bank collection of development indicators, compiled from officially-recognized international sources. It presents the most current and accurate global development data available, and includes national, regional and global estimates.

Retrieved on
May 20, 2024
Citation
This is the citation of the original data obtained from the source, prior to any processing or adaptation by Our World in Data. To cite data downloaded from this page, please use the suggested citation given in Reuse This Work below.
World Bank's World Development Indicators (WDI).

How we process data at Our World in Data

All data and visualizations on Our World in Data rely on data sourced from one or several original data providers. Preparing this original data involves several processing steps. Depending on the data, this can include standardizing country names and world region definitions, converting units, calculating derived indicators such as per capita measures, as well as adding or adapting metadata such as the name or the description given to an indicator.

At the link below you can find a detailed description of the structure of our data pipeline, including links to all the code used to prepare data across Our World in Data.

Read about our data pipeline

Reuse this work

  • All data produced by third-party providers and made available by Our World in Data are subject to the license terms from the original providers. Our work would not be possible without the data providers we rely on, so we ask you to always cite them appropriately (see below). This is crucial to allow data providers to continue doing their work, enhancing, maintaining and updating valuable data.
  • All data, visualizations, and code produced by Our World in Data are completely open access under the Creative Commons BY license. You have the permission to use, distribute, and reproduce these in any medium, provided the source and authors are credited.

Citations

How to cite this page

To cite this page overall, including any descriptions, FAQs or explanations of the data authored by Our World in Data, please use the following citation:

“Data Page: Renewable freshwater resources per capita”. Our World in Data (2024). Data adapted from Food and Agriculture Organization of the United Nations (via World Bank). Retrieved from https://ourworldindata.org/grapher/renewable-water-resources-per-capita [online resource]
How to cite this data

In-line citationIf you have limited space (e.g. in data visualizations), you can use this abbreviated in-line citation:

Multiple sources compiled by World Bank (2024) – processed by Our World in Data

Full citation

Multiple sources compiled by World Bank (2024) – processed by Our World in Data. “Renewable freshwater resources per capita” [dataset]. Food and Agriculture Organization of the United Nations (via World Bank), “World Development Indicators” [original data]. Retrieved July 2, 2024 from https://ourworldindata.org/grapher/renewable-water-resources-per-capita