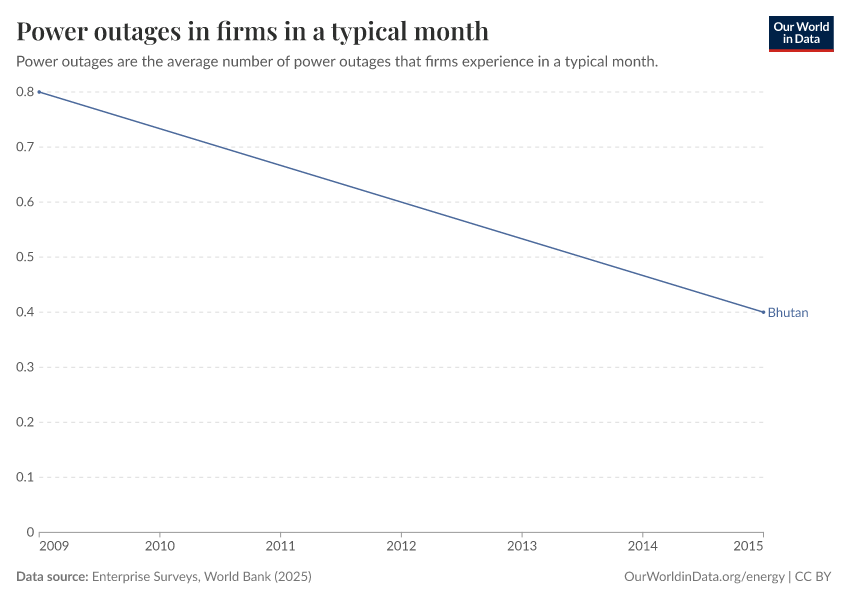
Power outages are the average number of power outages that establishments experience in a typical month.
Limitations and exceptions:
The sampling methodology for Enterprise Surveys is stratified random sampling. In a simple random sample, all members of the population have the same probability of being selected and no weighting of the observations is necessary. In a stratified random sample, all population units are grouped within homogeneous groups and simple random samples are selected within each group. This method allows computing estimates for each of the strata with a specified level of precision while population estimates can also be estimated by properly weighting individual observations. The sampling weights take care of the varying probabilities of selection across different strata. Under certain conditions, estimates' precision under stratified random sampling will be higher than under simple random sampling (lower standard errors may result from the estimation procedure).
The strata for Enterprise Surveys are firm size, business sector, and geographic region within a country. Firm size levels are 5-19 (small), 20-99 (medium), and 100+ employees (large-sized firms). Since in most economies, the majority of firms are small and medium-sized, Enterprise Surveys oversample large firms since larger firms tend to be engines of job creation. Sector breakdown is usually manufacturing, retail, and other services. For larger economies, specific manufacturing sub-sectors are selected as additional strata on the basis of employment, value-added, and total number of establishments figures. Geographic regions within a country are selected based on which cities/regions collectively contain the majority of economic activity.
Ideally the survey sample frame is derived from the universe of eligible firms obtained from the country’s statistical office. Sometimes the master list of firms is obtained from other government agencies such as tax or business licensing authorities. In some cases, the list of firms is obtained from business associations or marketing databases. In a few cases, the sample frame is created via block enumeration, where the World Bank “manually” constructs a list of eligible firms after 1) partitioning a country’s cities of major economic activity into clusters and blocks, 2) randomly selecting a subset of blocks which will then be enumerated. In surveys conducted since 2005-06, survey documentation which explains the source of the sample frame and any special circumstances encountered during survey fieldwork are included with the collected datasets.
Obtaining panel data, i.e. interviews with the same firms across multiple years, is a priority in current Enterprise Surveys. When conducting a new Enterprise Survey in a country where data was previously collected, maximal effort is expended to re-interview as many firms (from the prior survey) as possible. For these panel firms, sampling weights can be adjusted to take into account the resulting altered probabilities of inclusion in the sample frame.
Statistical concept and methodology:
Firm-level surveys have been conducted since the 1990's by different units within the World Bank. Since 2005-06, most data collection efforts have been centralized within the Enterprise Analysis Unit. Surveys implemented by the Enterprise Analysis Unit follow the Global Methodology.
Private contractors conduct the Enterprise Surveys on behalf of the World Bank. Due to sensitive survey questions addressing business-government relations and bribery-related topics, private contractors, rather than any government agency or an organization/institution associated with government, are hired by the World Bank to collect the data.
Confidentiality of the survey respondents and the sensitive information they provide is necessary to ensure the greatest degree of survey participation, integrity and confidence in the quality of the data. Surveys are usually carried out in cooperation with business organizations and government agencies promoting job creation and economic growth, but confidentiality is never compromised.
The Enterprise Survey is answered by business owners and top managers. Sometimes the survey respondent calls company accountants and human resource managers into the interview to answer questions in the sales and labor sections of the survey. Typically 1200-1800 interviews are conducted in larger economies, 360 interviews are conducted in medium-sized economies, and for smaller economies, 150 interviews take place.
The manufacturing and services sectors are the primary business sectors of interest. This corresponds to firms classified with ISIC codes 15-37, 45, 50-52, 55, 60-64, and 72 (ISIC Rev.3.1). Formal (registered) companies with 5 or more employees are targeted for interview. Services firms include construction, retail, wholesale, hotels, restaurants, transport, storage, communications, and IT. Firms with 100% government/state ownership are not eligible to participate in an Enterprise Survey. Occasionally, for a few surveyed countries, other sectors are included in the companies surveyed such as education or health-related businesses. In each country, businesses in the cities/regions of major economic activity are interviewed.
In some countries, other surveys, which depart from the usual Enterprise Survey methodology, are conducted. Examples include 1) Informal Surveys- surveys of informal (unregistered) enterprises, 2) Micro Surveys- surveys fielded to registered firms with less than five employees, and 3) Financial Crisis Assessment Surveys- short surveys administered by telephone to assess the effects of the global financial crisis of 2008-09.
The Enterprise Surveys Unit uses two instruments: the Manufacturing Questionnaire and the Services Questionnaire. Although many questions overlap, some are only applicable to one type of business. For example, retail firms are not asked about production and nonproduction workers.
The standard Enterprise Survey topics include firm characteristics, gender participation, access to finance, annual sales, costs of inputs/labor, workforce composition, bribery, licensing, infrastructure, trade, crime, competition, capacity utilization, land and permits, taxation, informality, business-government relations, innovation and technology, and performance measures.
Over 90% of the questions objectively ascertain characteristics of a country’s business environment. The remaining questions assess the survey respondents’ opinions on what are the obstacles to firm growth and performance. The mode of data collection is face-to-face interviews.
Notes from original source:
All surveys were administered using the Enterprise Surveys methodology as outlined in the Methodology page which can be found from www.enterprisesurveys.org.
