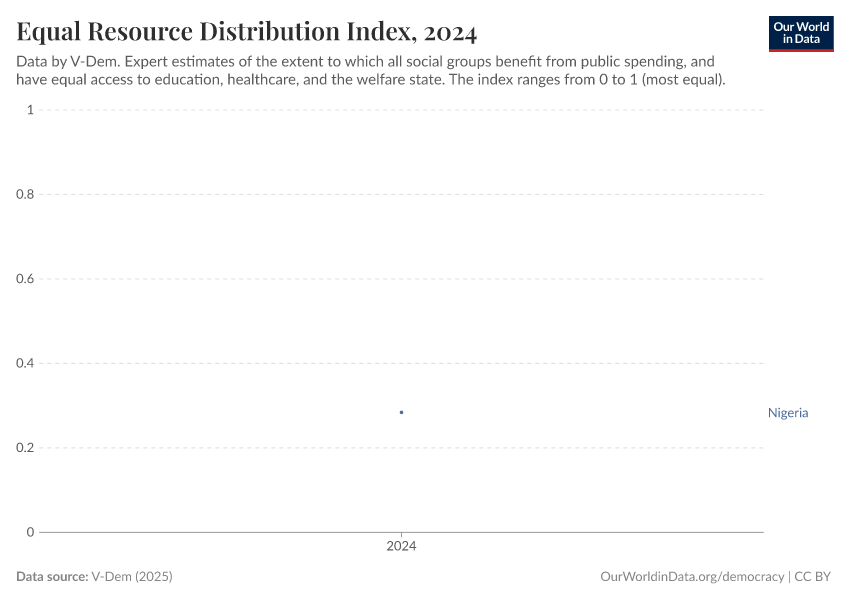
Equal resource distribution index

What you should know about this indicator
We provide two kinds of regional averages: country averages and population-weighted averages. Country averages weigh each country equally and give a sense of how the typical country is doing. Population-weighted averages weigh countries with larger populations more and therefore better reflect the average person's experience.
Sources and processing
This data is based on the following sources
How we process data at Our World in Data
All data and visualizations on Our World in Data rely on data sourced from one or several original data providers. Preparing this original data involves several processing steps. Depending on the data, this can include standardizing country names and world region definitions, converting units, calculating derived indicators such as per capita measures, as well as adding or adapting metadata such as the name or the description given to an indicator.
At the link below you can find a detailed description of the structure of our data pipeline, including links to all the code used to prepare data across Our World in Data.
Notes on our processing step for this indicator
Region aggregates
The default regional aggregates (including values for the World) have been estimated by averaging the country values. These are only estimated when data for most countries and populations is available (i.e. 70% for most continents). We have used the list of countries in 1900 as a reference.
In addition, regional aggregates with names like "Region (population-weighted)" (including values for World) have been estimated by averaging the country values weighted by population. The population values are from the UN WPP 2024 revision dataset. These are only estimated when 70% of people in region have data for the given year.
Data imputation
We expand the years covered by V-Dem further: To expand the time coverage of today's countries and include more of the period when they were still non-sovereign territories, we identified the historical entity they were a part of and used that regime's data whenever available
For example, V-Dem only provides regime data since Bangladesh's independence in 1971. There is, however, regime data for Pakistan and the colony of India, both of which the current territory of Bangladesh was a part. We, therefore, use the regime data of Pakistan for Bangladesh from 1947 to 1970, and the regime data of India from 1789 to 1946. We did so for all countries with a past or current population of more than one million.
For more details on the imputation methodology and which countries are affected, refer to this file.
Reuse this work
- All data produced by third-party providers and made available by Our World in Data are subject to the license terms from the original providers. Our work would not be possible without the data providers we rely on, so we ask you to always cite them appropriately (see below). This is crucial to allow data providers to continue doing their work, enhancing, maintaining and updating valuable data.
- All data, visualizations, and code produced by Our World in Data are completely open access under the Creative Commons BY license. You have the permission to use, distribute, and reproduce these in any medium, provided the source and authors are credited.
Citations
How to cite this page
To cite this page overall, including any descriptions, FAQs or explanations of the data authored by Our World in Data, please use the following citation:
“Data Page: Equal resource distribution index”, part of the following publication: Bastian Herre, Lucas Rodés-Guirao, and Esteban Ortiz-Ospina (2013) - “Democracy”. Data adapted from V-Dem. Retrieved from https://archive.ourworldindata.org/20251209-133038/grapher/equal-resource-distribution-index.html [online resource] (archived on December 9, 2025).How to cite this data
In-line citationIf you have limited space (e.g. in data visualizations), you can use this abbreviated in-line citation:
V-Dem (2025) – processed by Our World in DataFull citation
V-Dem (2025) – processed by Our World in Data. “Equal resource distribution index – V-Dem” [dataset]. V-Dem, “Democracy report v15” [original data]. Retrieved December 14, 2025 from https://archive.ourworldindata.org/20251209-133038/grapher/equal-resource-distribution-index.html (archived on December 9, 2025).