"Latent variable model
In the main manuscript, we present, estimate, and describe a latent variable model that links together observed dataset values from across many sources of military expenditure data.
We are interested in estimating is country-year military spending. Using military ex- penditure data presents several challenges because the datasets are incomplete, cover short periods of time, and are presented in many different monetary units-of-measurement. To overcome these challenges, we specify a dynamic latent variable measurement model that links all of the available information across different contemporary and historical sources of arms spending data. We essentially want to estimate the country-year distribution or simply the average of military spending across all the available observed dataset values so that we generate the best estimate of military spending for each of the country-year units.
The observed dataset values are linked together through the estimation of a country- year parameter or latent trait. However, the latent trait parameter itself is not directly of interest for inference because it does not have a direct monetary interpretation. This is because it is scaled by the item-specific intercept parameter which transforms the latent trait into the unit-of-measurement of any one of the originally observed military expenditure variables. The measurement model provides predictive intervals for each of the original observed variables on the original scales of these variables. Notationally, we represent the observed country-year dataset values as yitj where i indexes countries, t indexes years of time, and j indexes the dataset. The model then produces posterior predictive distributions of yitj, which we denote as y ̃itj. These are normally distributed values (on the natural log scale). We can therefore take the average of y ̃itj as E(y ̃itj) or the standard deviation of y ̃itj as sd(y ̃itj).
For the applications in the main manuscript and in this appendix, y ̃itj is the key the quantity we care about. It is the estimated value of yitj, conditional on all the other observed information about military spending for a given country-year unit, which is captured by the latent trait θcur[it] and then scaled by the item-specific intercept parameter αj. Note that, as described in the main manuscript, that we also account for the relationship between current and constant monetary values through inflation by this year scaling relationship: θcon[it] = βt ∗ θcur[it]
We approximate the posterior distributions of y ̃itj by taking repeated draws from Bayesian simulation model. Specifically, the measurement models are estimated with four MCMC chains to run for 2,000 iterations each using the Stan software (Stan Development Team, 2021). The first 1,000 iterations are thrown away as a burn-in or warmup period. The 4,000 remaining samples were thinned by a factor of 2 and are used to generate the posterior prediction intervals for the original observed variables. Diagnostics (i.e. trace plots, effective sample size, and R-hats) all suggest convergence (Gelman and Hill, 2007).
So in the end, we have a normally distributed, posterior prediction interval: y ̃itj for every country-year dataset. We can then compare the observed dataset values to these prediction intervals to see how well the model is doing at approximating these observed dataset values. We learn a lot from these descriptive comparisons as we demonstrate in the main manuscript and in additional detail in the rest of this appendix. Ultimately, these comparisons help us validate the resulting estimates relative to other estimates. Even the original data represents historic and government estimates, so such validation efforts are essential, especially when comparing long term historical trends and making predictions about the future."
"Military burdens
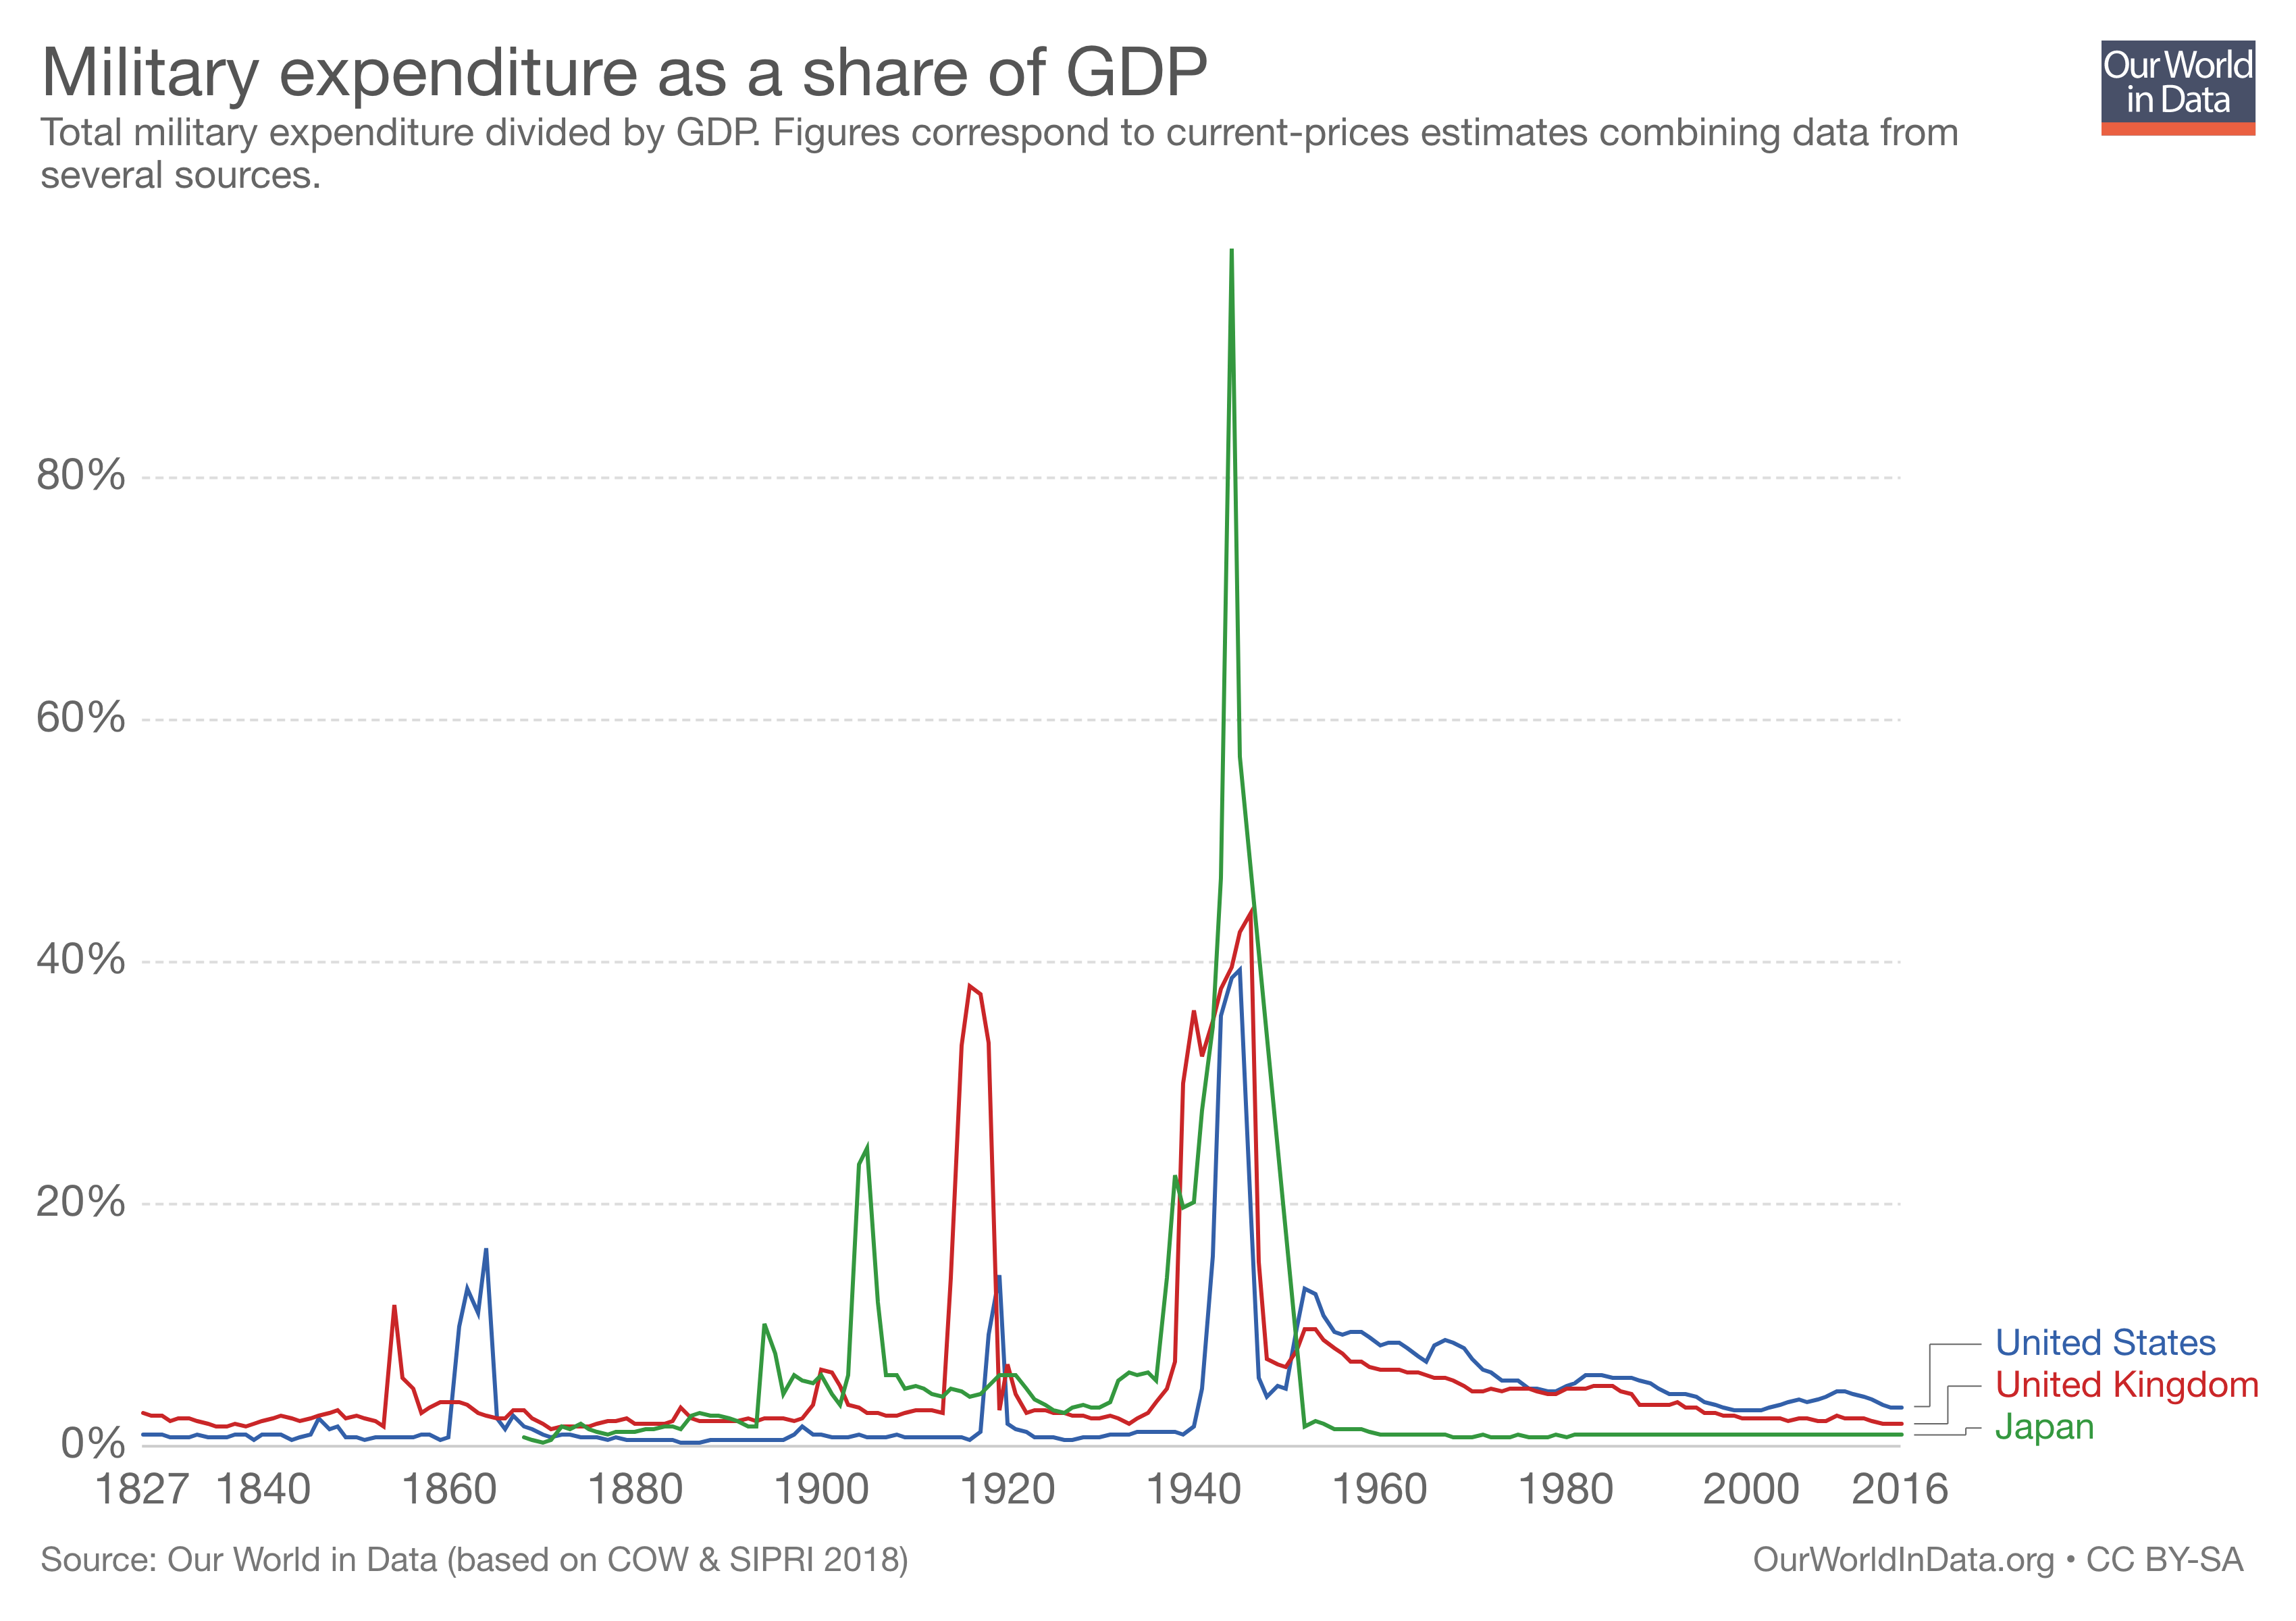
Military burdens is the ratio of states spending on arming to available monetary resources are an important area of research for international relations scholars (Anders, Fariss and Markowitz, 2020; Cappella Zielinski, 2016; Fearon, 2018; Lind, 2011; Norloff and Wohlforth, 2019). Here we consider the military burdens of several countries and regions over time, building on results published by Anders, Fariss and Markowitz (2020).
Anders, Fariss, and Markowitz demonstrate that surplus domestic product (SDP) is a better conceptual representation of the economic resources available to states to invest in arming than gross domestic product (GDP), previously the default measure (see e.g., Fearon, 2018; Khanna, Sandler and Shimizu, 1998; Rasler and Thompson, 1985). Thus, we measure military burdens in two ways: as ratios of spending to SDP and to GDP. To compute SDP for each state i in year t, we subtract from GDP the economic resources that the population consumes to survive, such that SDPit = GDPit − ((365 ∗ τ) ∗ Populationit), where is the subsistence threshold (SDP is truncated to 0 if the resources needed for subsistence exceed GDP). Anders, Fariss, and Markowitz (2020) primarily use a subsistence threshold of $3 per day per person (and thresholds at $2, $1, and $0). In order to facilitate comparisons with previous results, we show military burdens at the $3 threshold. However, we also show results using a $2 per day subsistence threshold, as we are particularly interested in analyzing arming levels and military burdens in earlier historical time periods (facilitated by our new estimates of arming expenditures). Consistent with Anders, Fariss, and Markowitz (2020), we show here that when scaling military expenditures by SDP, the military burdens of poor states are much higher than the conventional measure (scaled by GDP).
We make two notable improvements to the calculation of military burdens in this paper. First, by including our new estimates of arms spending, we are able to incorporate uncertainty about expenditure values into the estimate of military burdens. Second, we include updated estimates of GDP from a recent article by Fariss et al. (2022), which also include uncertainty estimates, and recalculate SDP based on those estimates. In sum, we are able to bring together the most up-to-date estimates of military burdens component measures, and showcase key patterns for important states and regions over time."


