Deforestation and Forest Loss
Explore long-term changes in deforestation and deforestation rates across the world today.
Which countries are gaining, and which are losing forests?
Before we look specifically at trends in deforestation across the world, it's useful to understand the net change in forest cover. The net change in forest cover measures any gains in forest cover — either through natural forest expansion or afforestation through tree planting — minus deforestation.
This map shows the net change in forest cover across the world. Countries with a positive change (shown in green) are gaining forests faster than they're losing them. Countries with a negative change (shown in red) are losing more than they're able to restore.
A note on UN FAO forestry data
Data on net forest change, afforestation, and deforestation is sourced from the UN Food and Agriculture Organization's Forest Resources Assessment. Since year-to-year changes in forest cover can be volatile, the UN FAO provides this annual data averaged over five-year periods.
How much deforestation occurs each year?
Net forest loss is not the same as deforestation — it measures deforestation plus any gains in forest over a given period.
Between 2010 and 2020, the net loss in forests globally was 4.7 million hectares per year.1 However, deforestation rates were much higher.
The UN FAO estimates that 10 million hectares of forest are cut down each year.
This interactive map shows deforestation rates across the world.
Read more about historical deforestation here:
The world has lost one-third of its forest, but an end of deforestation is possible
Over the last 10,000 years the world has lost one-third of its forests. An area twice the size of the United States. Half occurred in the last century.
Global deforestation peaked in the 1980s. Can we bring it to an end?
Since the end of the last ice age — 10,000 years ago — the world has lost one-third of its forests.2 Two billion hectares of forest — an area twice the size of the United States — has been cleared to grow crops, raise livestock, and for use as fuelwood.
Previously, we looked at this change in global forests over the long run. What this showed was that although humans have been deforesting the planet for millennia, the rate of forest loss accelerated rapidly in the last few centuries. Half of the global forest loss occurred between 8,000 BCE and 1900; the other half was lost in the last century alone.
To understand this more recent loss of forest, let’s zoom in on the last 300 years. The world lost 1.5 billion hectares of forest over that period. That’s an area 1.5 times the size of the United States.
In the chart, we see the decadal losses and gains in global forest cover. On the horizontal axis, we have time, spanning from 1700 to 2020; on the vertical axis, we have the decadal change in forest cover. The taller the bar, the larger the change in forest area. This is measured in hectares; one hectare is equivalent to 10,000 m².
Forest loss measures the net change in forest cover: the loss in forests due to deforestation plus any increase in forest through afforestation or natural expansion.3
Unfortunately, there is no single source that provides consistent and transparent data on deforestation rates over this period of time. Methodologies change over time, and estimates — especially in earlier periods — are highly uncertain. This means I’ve had to use two separate datasets to show this change over time. As we’ll see, they produce different estimates of deforestation for an overlapping decade — the 1980s — which suggests that these are not directly comparable. I do not recommend combining them into a single series, but the overall trends are still applicable and tell us an important story about deforestation over the last three centuries.
The first series of data comes from Williams (2006), who estimates deforestation rates from 1700 to 1995.4 Due to poor data resolution, these are often given as average rates over longer periods — for example, annual average rates are given over the period from 1700 to 1849 and 1920 to 1949. That’s why these rates look strangely consistent over a long period of time.
The second series comes from the UN Food and Agriculture Organization (FAO). It produces a new assessment of global forests every five years.5
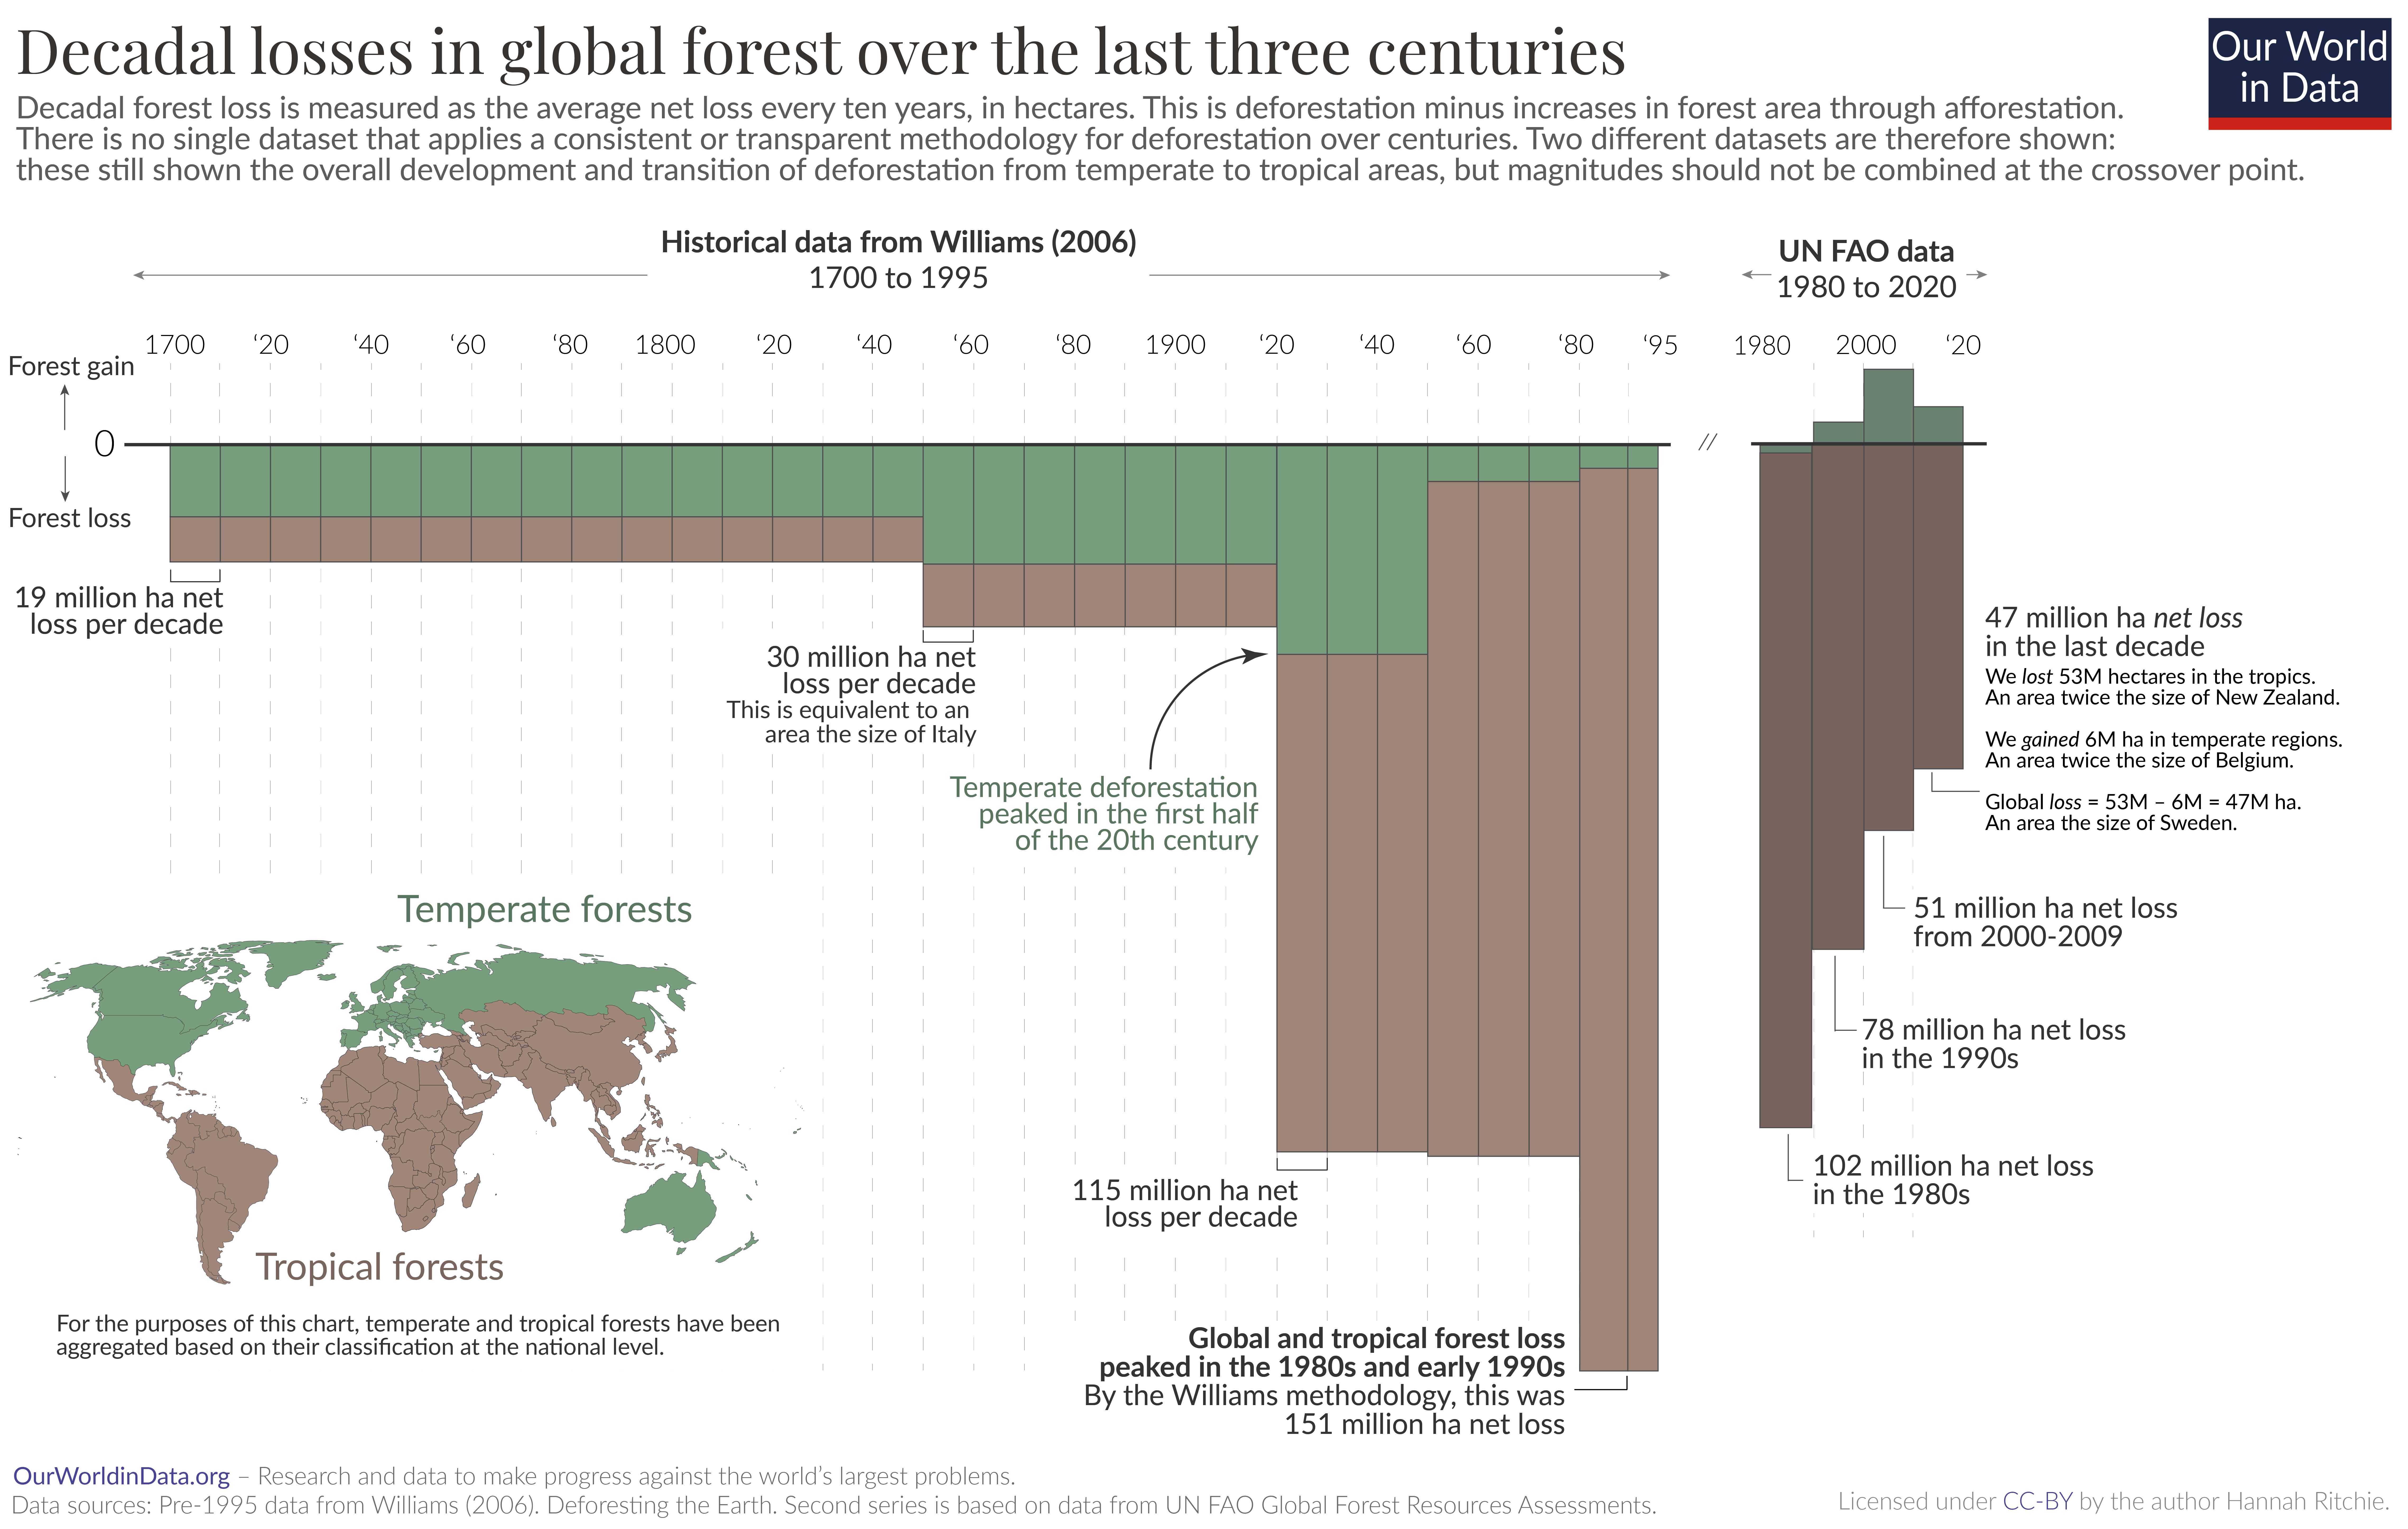
The rate and location of forest loss changed a lot. From 1700 to 1850, 19 million hectares were being cleared every decade. That’s around half the size of Germany.
Most temperate forests across Europe and North America were being lost at this time. Population growth meant that today’s rich countries needed more and more resources such as land for agriculture, wood for energy, and construction.6
Moving into the 20th century, there was a stepwise change in demand for agricultural land and energy from wood. Deforestation rates accelerated. This increase was mostly driven by tropical deforestation in countries across Asia and Latin America.
Global forest loss appears to have reached its peak in the 1980s. The two sources do not agree on the magnitude of this loss: Williams (2006) estimates a loss of 150 million hectares — an area half the size of India — during that decade.
Interestingly, the UN FAO 1990 report also estimated that deforestation in tropical ‘developing’ countries was 154 million hectares. However, it was estimated that the regrowth of forests offset some of these losses, leading to a net loss of 102 million hectares.7
The latest UN Forest Resources Assessment estimates that the net loss in forests has declined in the last three decades, from 78 million hectares in the 1990s to 47 million hectares in the 2010s.
This data maps an expected pathway based on what we know from how human-forest interactions evolve.
As we explore in more detail later on, countries tend to follow a predictable development in forest cover, a U-shaped curve.8 They lose forests as populations grow and demand for agricultural land and fuel increases, but eventually, they reach the so-called ‘forest transition point’ where they begin to regrow more forests than they lose.
That is what has happened in temperate regions: they have gone through a period of high deforestation rates before slowing and reversing this trend.
However, many countries — particularly in the tropics and sub-tropics — are still moving through this transition. Deforestation rates are still very high.
Deforestation rates are still high across the tropics
Large areas of forest are still being lost in the tropics today. This is particularly tragic because these are regions with the highest levels of biodiversity.
Let’s look at estimates of deforestation from the latest UN Forest report. This shows us raw deforestation rates without any adjustment for the regrowth or plantation of forests, which is arguably not as good for ecosystems or carbon storage.
This is shown in the chart below.
We can see that the UN does estimate that deforestation rates have fallen since the 1990s. However, there was very little progress from the 1990s to the 2000s and an estimated 26% drop in rates in the 2010s. In 2022, the FAO published a separate assessment based on remote sensing methods; it did not report data for the 1990s, but it also estimated a 29% reduction in deforestation rates from the early 2000s to the 2010s.
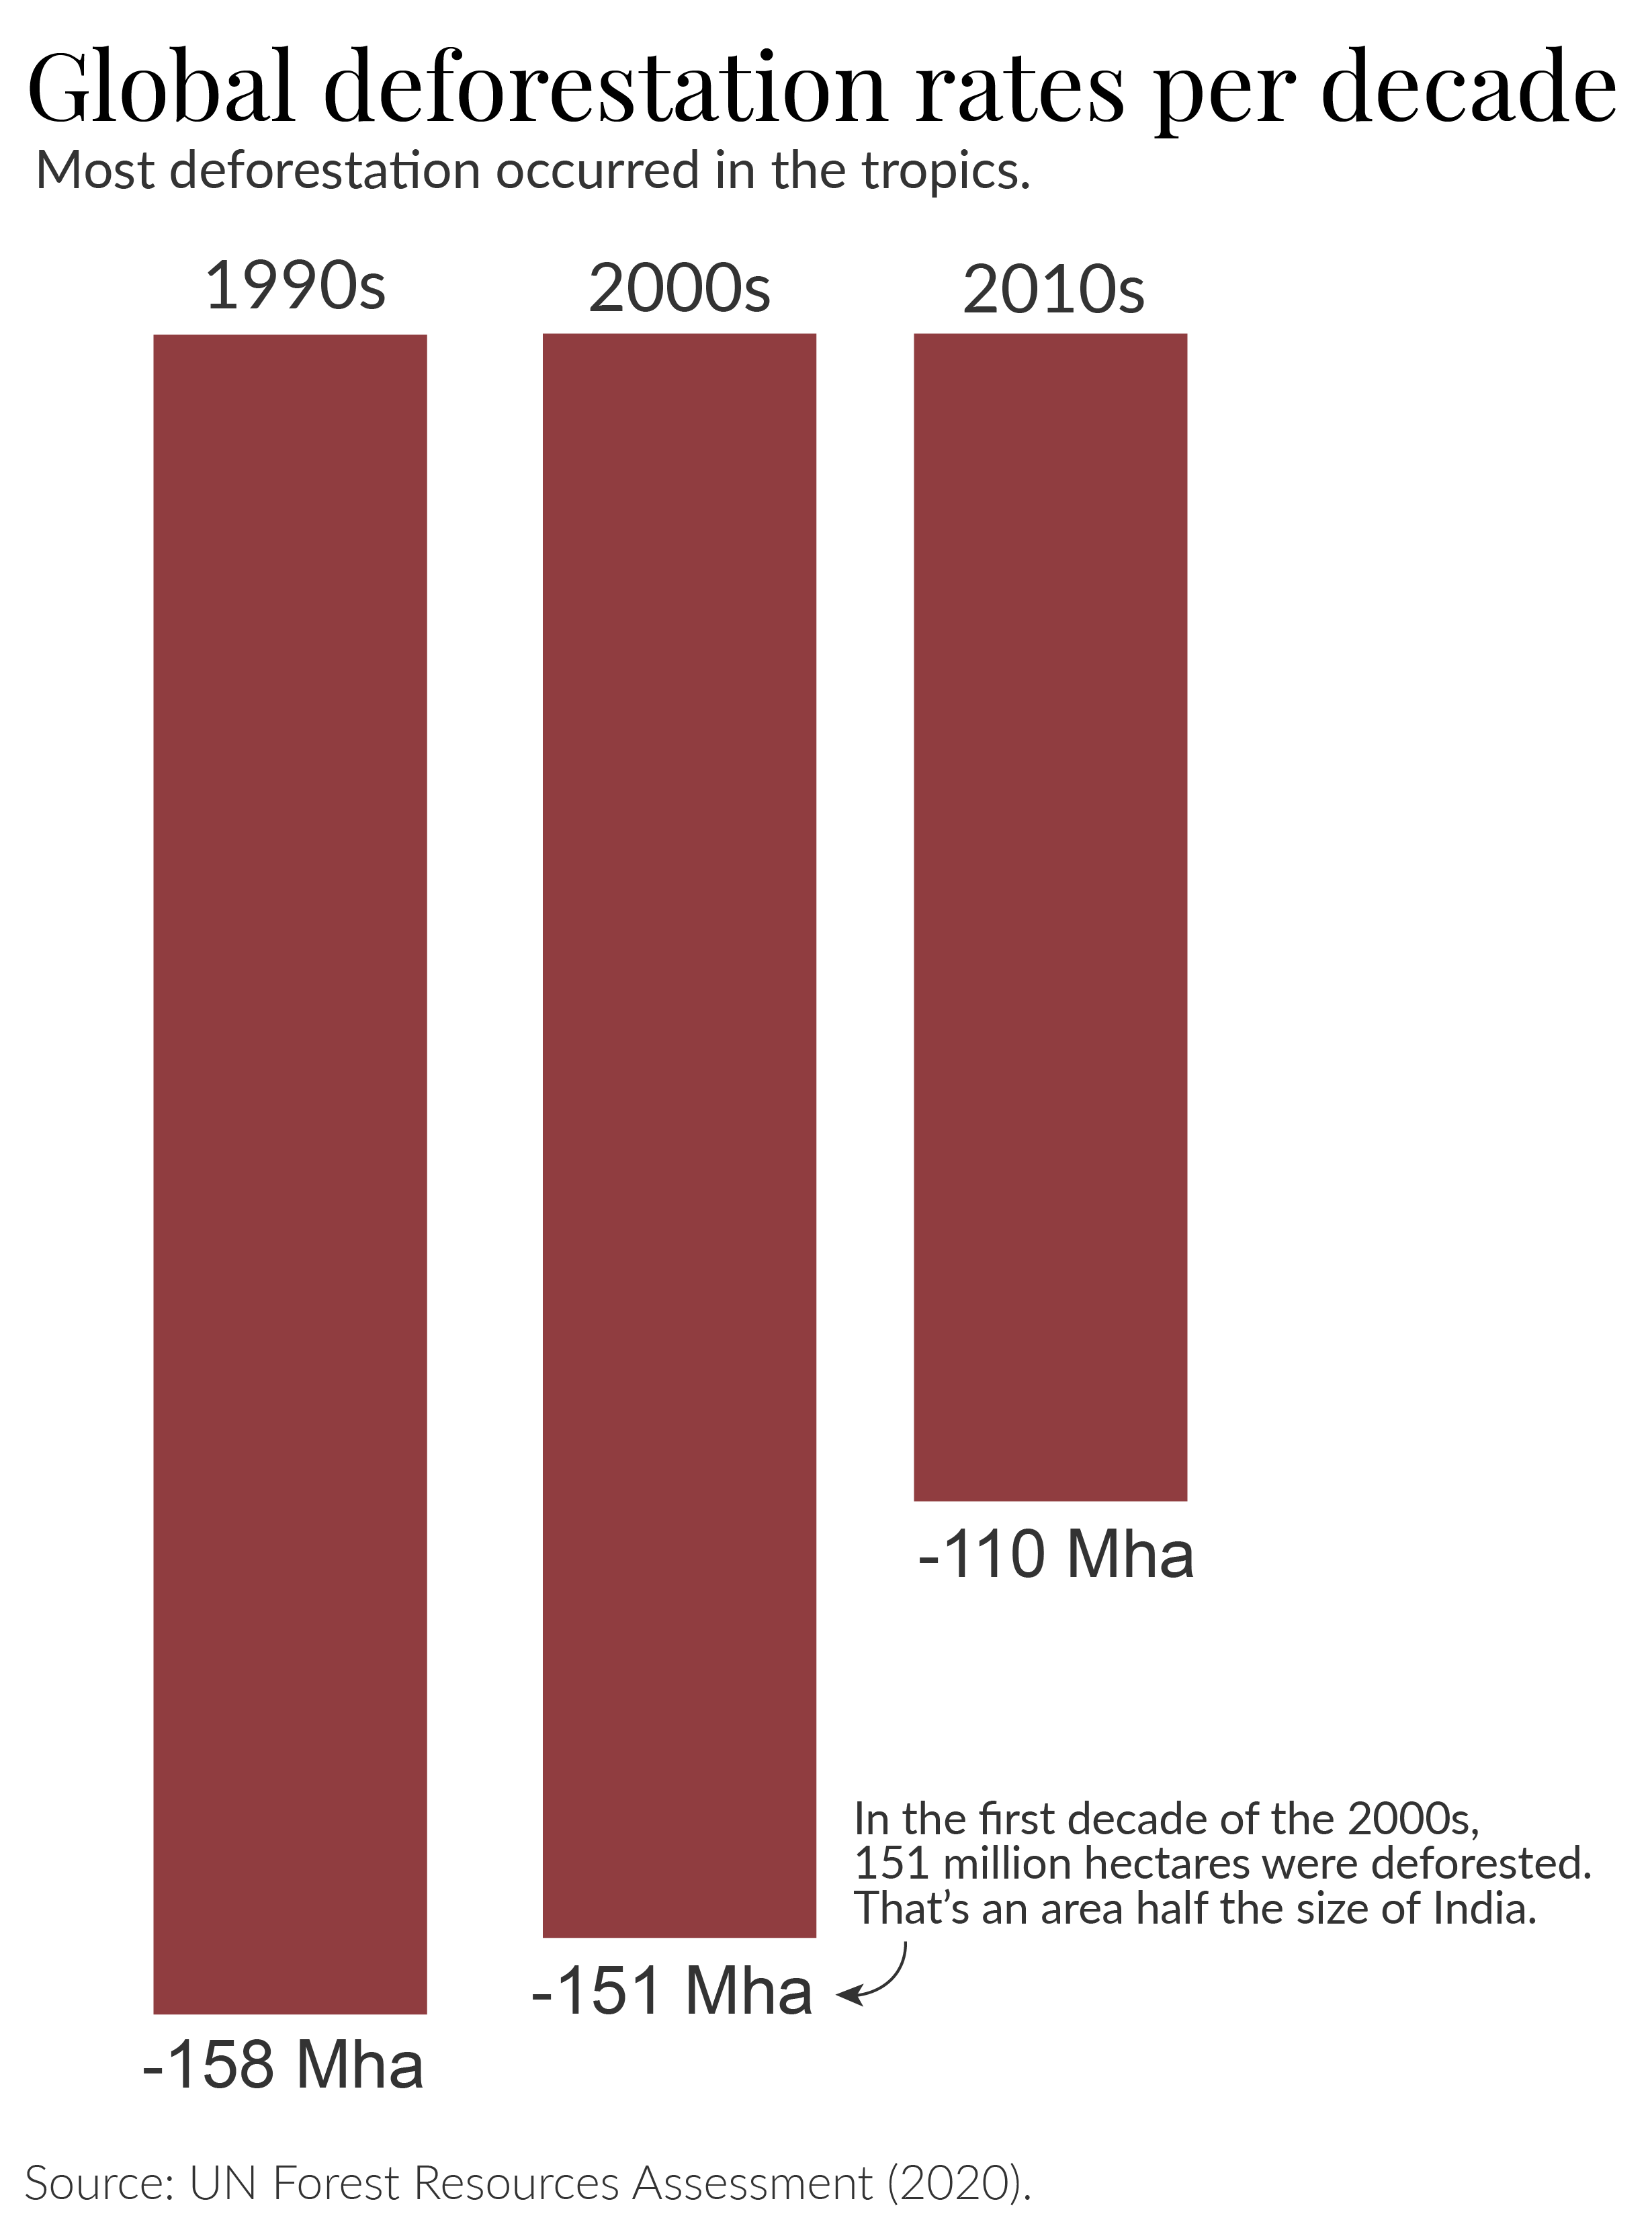
This is progress, but it needs to happen much faster. The world is still losing large amounts of primary forests every year. To put these numbers in context, during the 1990s and first decade of the 2000s, an area almost the size of India was deforested.9 Even with the ‘improved’ rates in the 2010s, this still amounted to an area around twice the size of Spain.10
The regrowth of forests is a positive development. In the chart below, we see how this affects the net change in global forests. Forest recovery and plantation ‘offsets’ a lot of deforestation such that the net losses are around half the rates of deforestation alone.
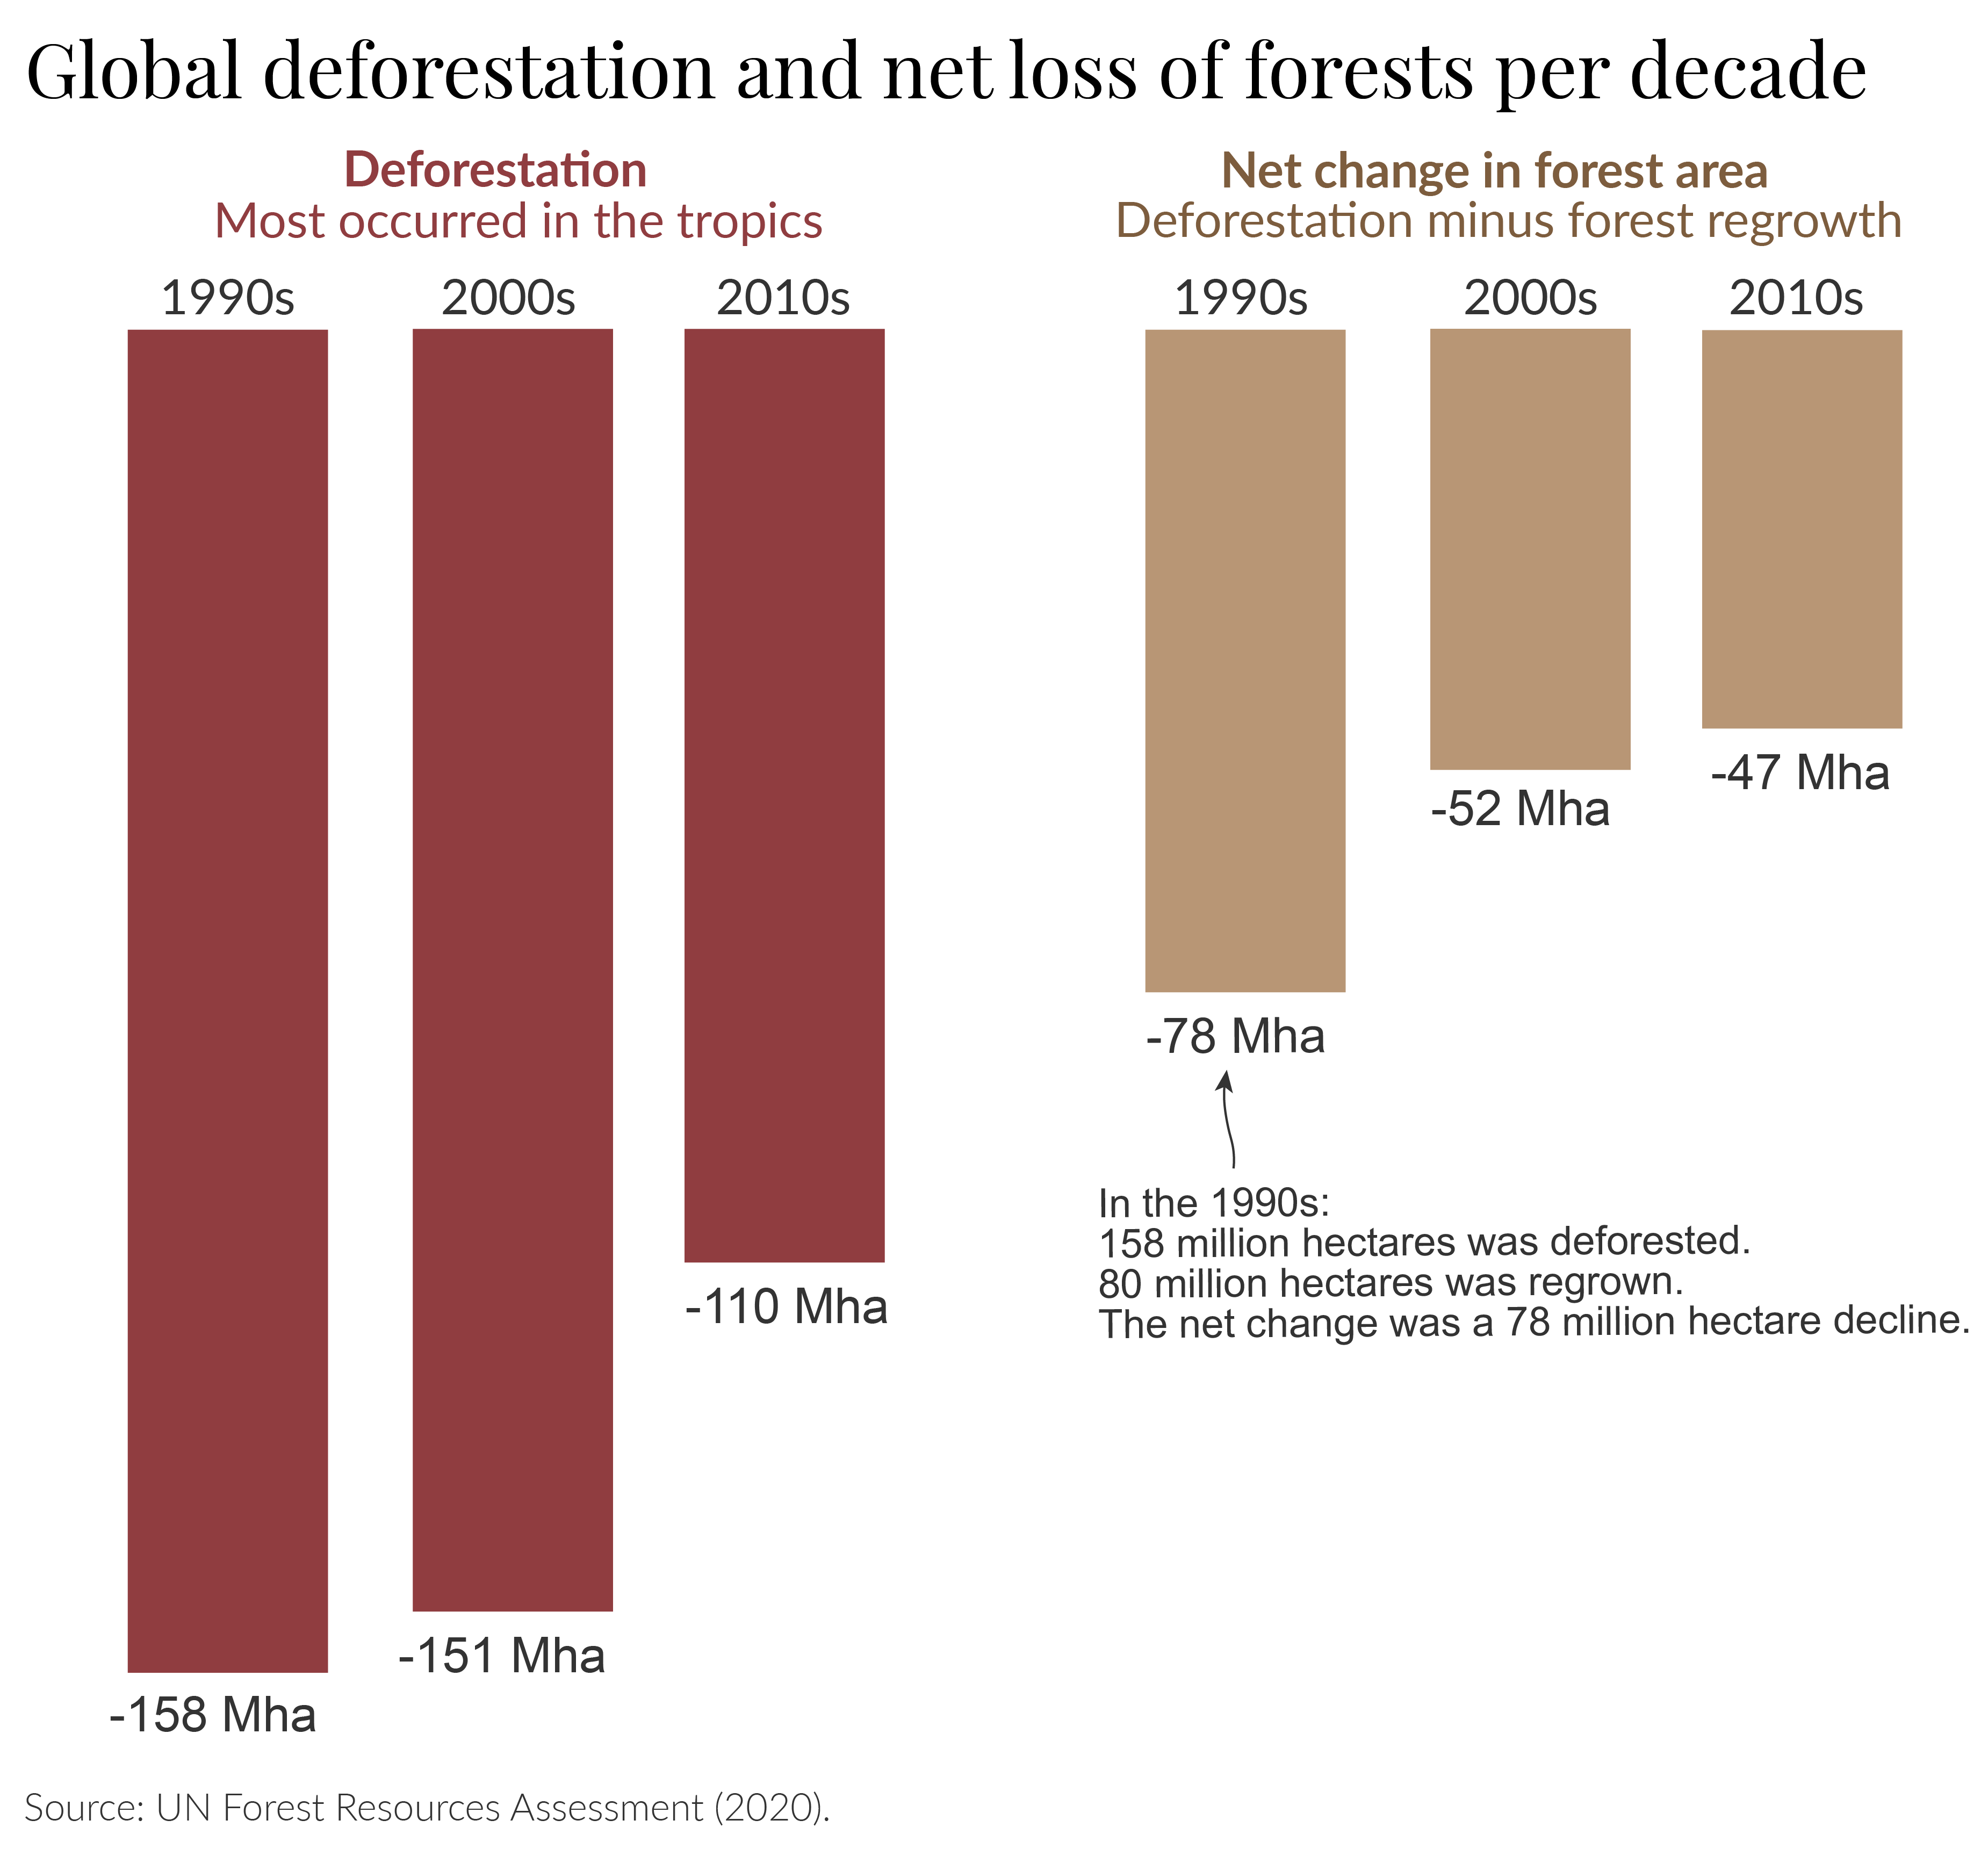
But we should be cautious here: it’s often not the case that the ‘positives’ of regrowing on planting one hectare of forest offset the ‘losses’ of one hectare of deforestation. Cutting down one hectare of rich tropical rainforest cannot be completely offset by the creation of on hectare of plantation forest in a temperate country.
Forest expansion is positive but does not negate the need to end deforestation.
The history of deforestation is a tragic one, in which we have lost not only wild and beautiful landscapes but also the wildlife within them. But, the fact that forest transitions are possible should give us confidence that a positive future is possible. Many countries have not only ended deforestation but have actually achieved substantial reforestation. It will be possible for our generation to achieve the same on a global scale and bring the 10,000-year history of forest loss to an end.
If we want to end deforestation, we need to understand where and why it’s happening, where countries are within their transition, and what can be done to accelerate their progress through it. We need to pass the transition point as soon as possible while minimizing the amount of forest we lose along the way.
In this article, I look at what drives deforestation, which helps us understand what we need to do to solve it.
Forest definitions and comparisons to other datasets
There is no universal definition of what a ‘forest’ is. That means there are a range of estimates of forest area and how this has changed over time.
In this article, in the recent period, I have used data from the UN’s Global Forest Resources Assessment (2020). The UN carries out these global forest stocktakes every five years. These forest figures are widely used in research, policy, and international targets, such as the Sustainable Development Goals.
The UN FAO has a very specific definition of a forest. It’s “land spanning more than 0.5 hectares with trees higher than 0.5 meters and a canopy cover of more than 10%, or trees able to reach these thresholds in situ.”
In other words, it has criteria for the area that must be covered (0.5 hectares), the minimum height of trees (0.5 meters), and a density of at least 10%.
Compare this to the UN Framework Convention on Climate Change (UNFCCC), which uses forest estimates to calculate land use carbon emissions, and its REDD+ Programme, where low-to-middle-income countries can receive finance for verified projects that prevent or reduce deforestation. It defines a forest as having a density of more than 10%, a minimum tree height of 2-5 meters, and a smaller area of at least 0.05 hectares.
It’s not just forest definitions that vary between sources. What is measured (and not measured) differs, too. Global Forest Watch is an interactive online dashboard that tracks ‘tree loss’ and ‘forest loss’ across the world. It measures this in real time and can provide better estimates of year-to-year variations in rates of tree loss.
However, the UN FAO and Global Forest Watch do not measure the same thing.
The UN FAO measures deforestation based on how land is used. It measures the permanent conversion of forested land to another use, such as pasture, croplands, or urbanization. Temporary changes in forest cover, such as losses through wildfire or small-scale shifting agriculture, are not included in deforestation figures because it is assumed that they will regrow. If the use of land has not changed, it is not considered deforestation.
Global Forest Watch (GFW) measures temporary changes in forests. It can detect changes in land cover but does not differentiate the underlying land use. All deforestation would be considered tree loss, but a lot of tree loss would not be considered as deforestation.
As GFW defines ‘forest loss’, “Loss” indicates the removal or mortality of tree cover and can be due to a variety of factors, including mechanical harvesting, fire, disease, or storm damage. As such, “loss” does not equate to deforestation.”
Therefore, we cannot directly compare these sources. This article from Global Forest Watch gives a good overview of the differences between the UN FAO's and GFW's methods.
Since GFW uses satellite imagery, its methods continually improve. This makes its ability to detect changes in forest cover even stronger. But it also means that comparisons over time are more difficult. It currently warns against comparing pre-2015 and post-2015 data since there was a significant methodological change at that time. Note that this is also a problem in UN FAO reports, as I’ll soon explain.
What data from GFW makes clear is that forest loss across the tropics is still very high, and in the last few years, little progress has been made. Since UN FAO reports are only published in 5-year intervals, they miss these shorter-term fluctuations in forest loss. The GFW’s shorter-interval stocktakes of how countries are doing will become increasingly valuable.
One final point to note is that UN FAO estimates have also changed over time, with improved methods and better access to data.
I looked at how net forest losses in the 1990s were reported across five UN reports: 2000, 2005, 2010, 2015, and 2020.
Estimated losses changed in each successive report:
- 2000 report: Net losses of 92 million hectares
- 2005 report: 89 million hectares
- 2010 report: 83 million hectares
- 2015 report: 72 million hectares
- 2020 report: 78 million hectares
This should not affect the overall trends reported in the latest report: the UN FAO should — as far as is possible — apply the same methodology to its 1990s, 2000s, and 2010s estimates. However, it does mean we should be cautious about comparing absolute magnitudes across different reports.
This is one challenge in presenting 1980 figures in the main visualization in this article. Later reports have not updated 1980 figures, so we have to rely on estimates from earlier reports. We don’t know whether 1980s losses would also be lower with the UN FAO’s most recent adjustments. If so, this would mean the reductions in net forest loss from the 1980s to 1990s were lower than is shown from available data.
Forest transitions: why do we lose then regain forests?
Globally, we deforest around ten million hectares of forest every year.11 That’s an area the size of Portugal every year. Around half of this deforestation is offset by regrowing forests, so overall, we lose around five million hectares each year.
Nearly all — 95% — of this deforestation occurs in the tropics. But not all of it is to produce products for local markets. 14% of deforestation is driven by consumers in the world’s richest countries — we import beef, vegetable oils, cocoa, coffee, and paper that has been produced on deforested land.12
The scale of deforestation today might give us little hope for protecting our diverse forests. But by studying how forests have changed over time, there’s good reason to think that a way forward is possible.
Many countries have lost and then regained forests over millennia.
Time and time again, we see examples of countries that have lost massive amounts of forests before reaching a turning point where deforestation not only slows but forests return. In the chart, we see historical reconstructions of country-level data on the share of land covered by forest (over decades, centuries, or even millennia, depending on the country). I have reconstructed long-term data using various studies, which I’ve documented here.
Many countries have much less forest today than they did in the past. Nearly half (47%) of France was forested 1000 years ago; today that’s just under one-third (31.4%). The same is true of the United States; back in 1630, 46% of the area of today’s USA was covered by forest. Today, that’s just 34%.
One thousand years ago, 20% of Scotland’s land was covered by forest. By the mid-18th century, only 4% of the country was forested. But then the trend turned, and it moved from deforestation to reforestation. For the last two centuries, forests have been growing and are almost back to where they were 1000 years ago.13
Forest Transitions: the U-shaped curve of forest change
What’s surprising is how consistent the pattern of change is across so many countries; as we’ve seen, they all seem to follow a ‘U-shaped curve.’ They first lose lots of forest but reach a turning point and begin to regain it again.
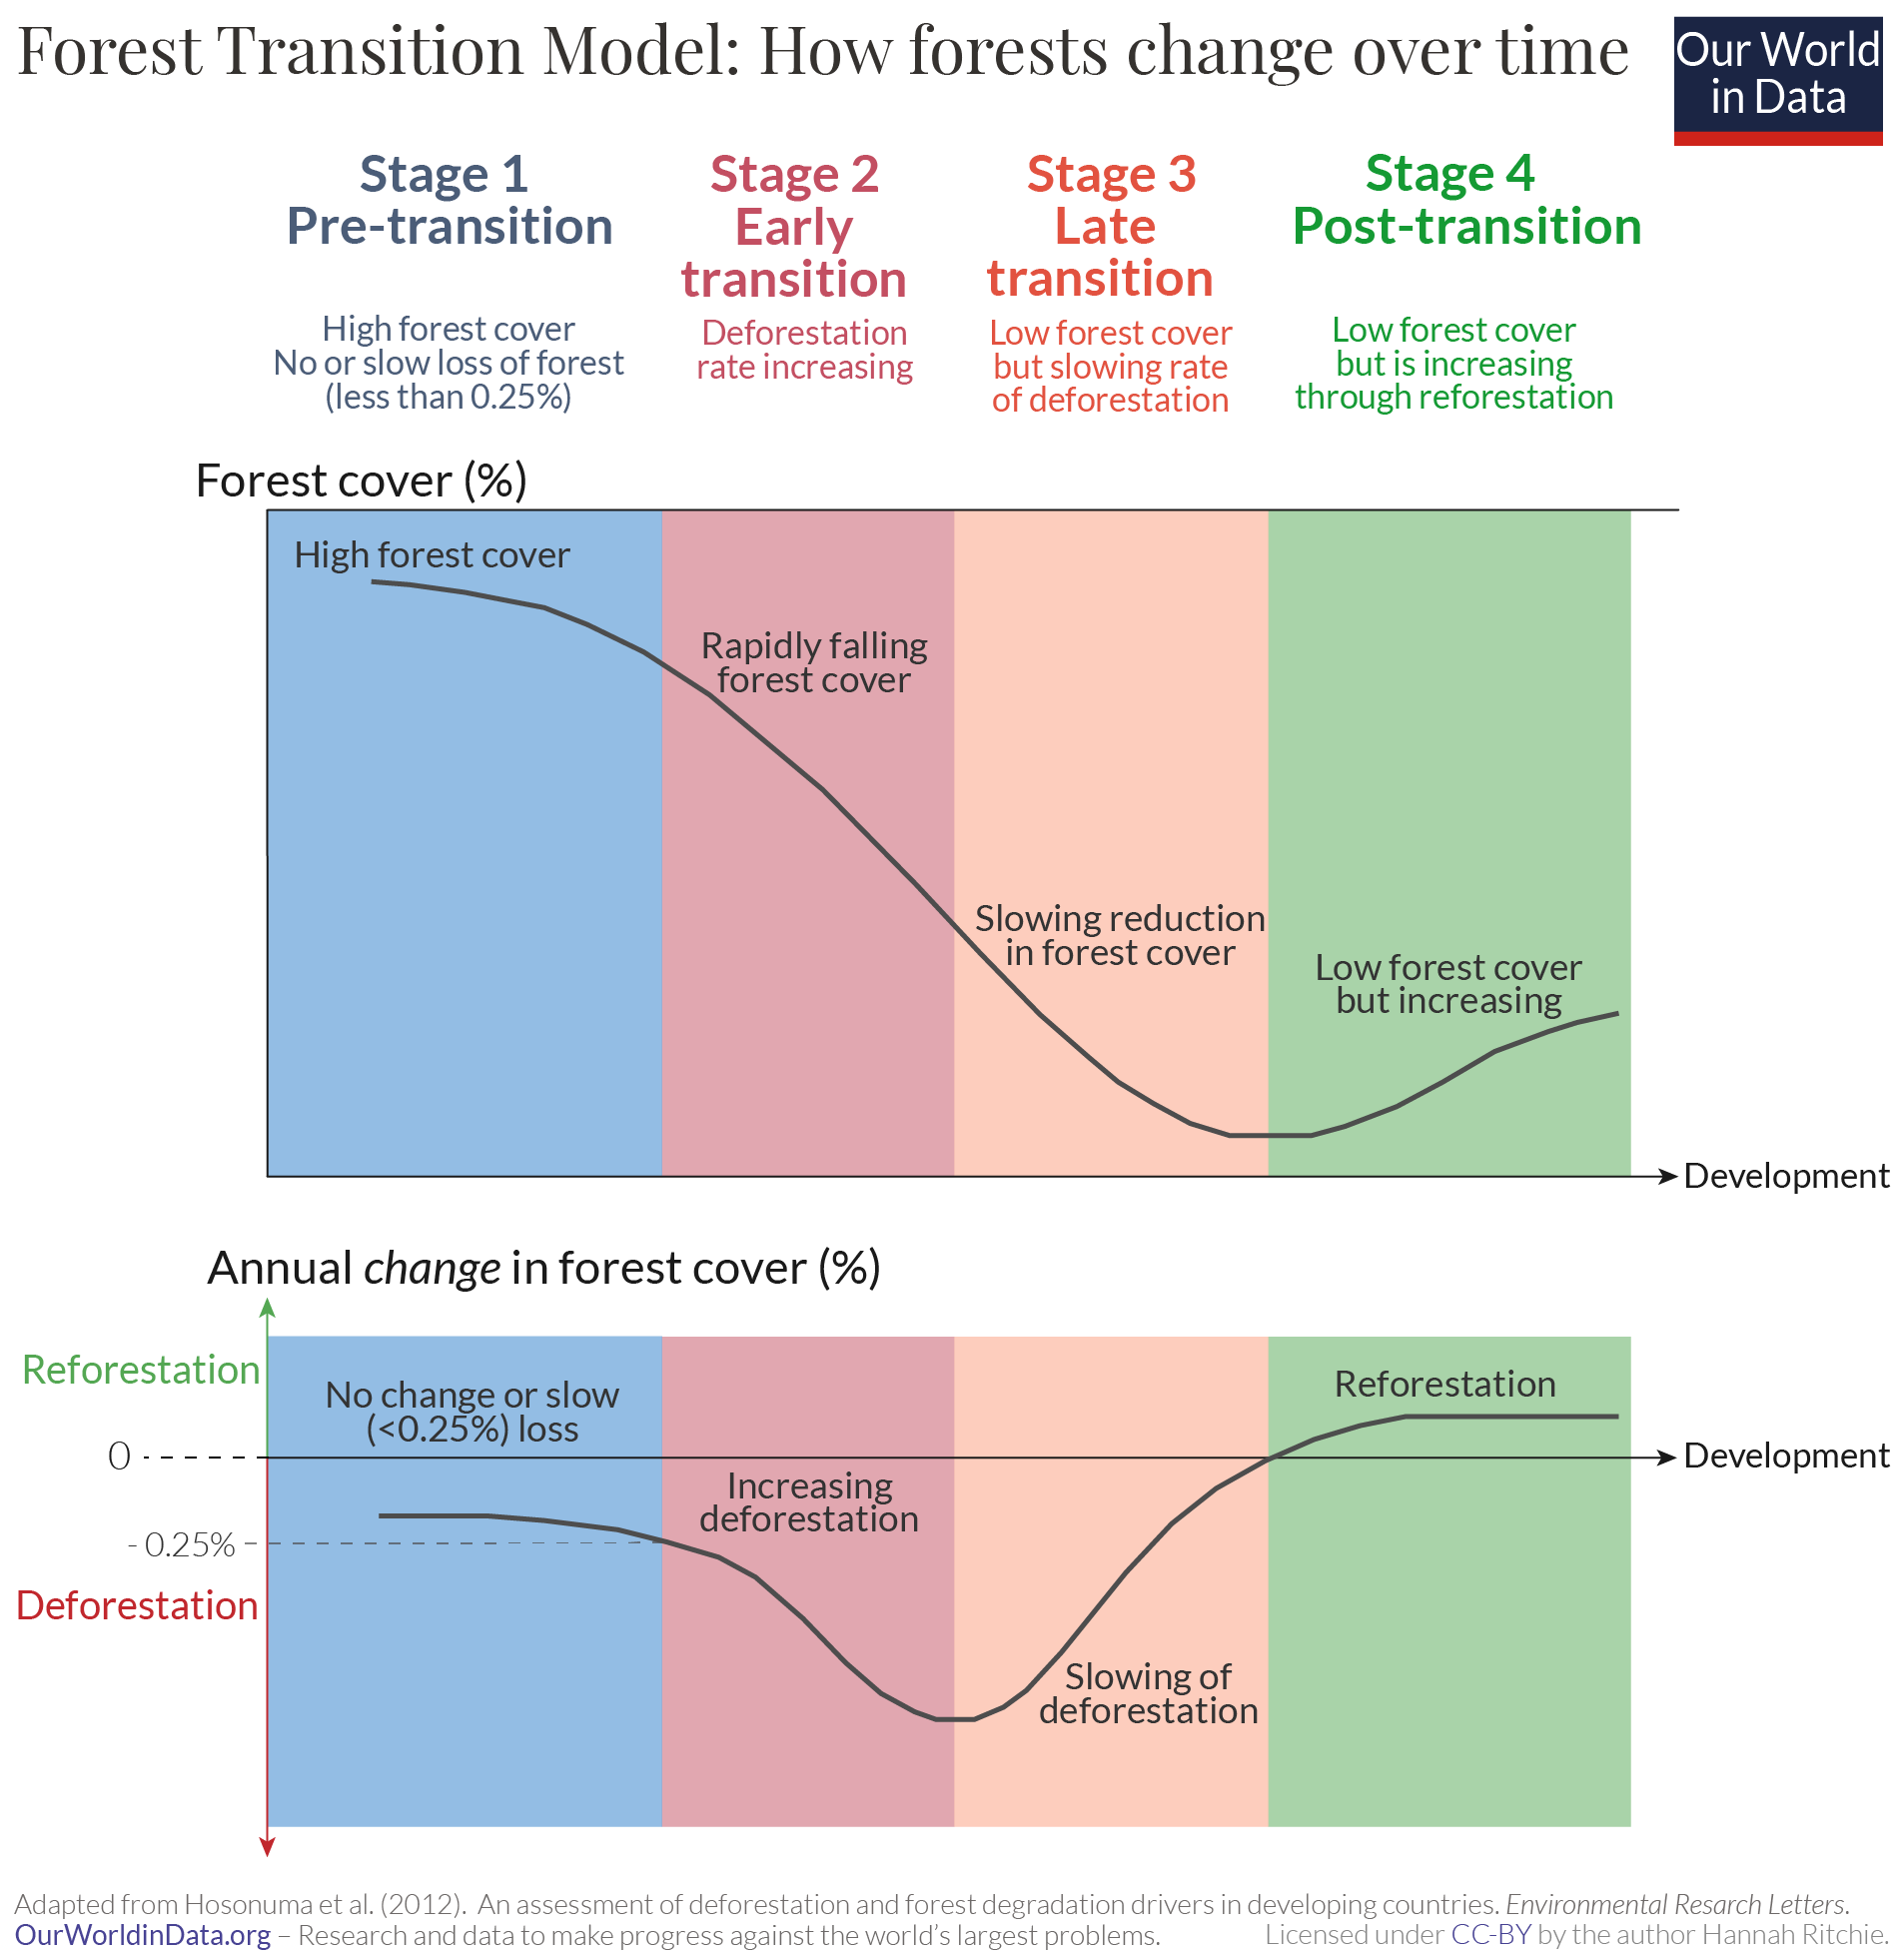
We can illustrate this through the so-called ‘Forest Transition Model.’ 14 This is shown in the chart. It breaks the change in forests into four stages, explained by two variables: the amount of forest cover a region has and the annual change in cover (how quickly it is losing or gaining forest).15
Stage 1 – The Pre-Transition phase is defined as having high levels of forest cover and no or only very slow losses over time. Countries may lose some forest each year, but this is at a very slow rate. Mather refers to an annual loss of less than 0.25% as a small loss.
Stage 2 – The Early Transition phase is when countries start to lose forests very rapidly. Forest cover falls quickly, and the annual loss of forest is high.
Stage 3 – The Late Transition phase is when deforestation rates start to slow down again. At this stage, countries are still losing forest each year, but at a lower rate than before. At the end of this stage, countries are approaching the ‘transition point.’
Stage 4 – The Post-Transition phase is when countries have passed the ‘transition point’ and are now gaining forest again. At the beginning of this phase, the forest area is at its lowest point. But forest cover increases through reforestation. The annual change is now positive.
Why do countries lose and then regain forests?
Many countries have followed this classic U-shaped pattern. What explains this?
There are two reasons that we cut down forests:
- Forest resources: we want the resources that they provide — the wood for fuel, building materials, or paper;
- Land: We want to use the land they occupy for something else, such as farmland to grow crops, pasture to raise livestock or land to build roads and cities.
Our demand for both of these initially increases as populations grow and poor people get richer. We need more fuelwood to cook, more houses to live in, and, importantly, more food to eat.
But, as countries continue to get richer, this demand slows. The rate of population growth tends to slow down. Instead of using wood for fuel, we switch to fossil fuels, or hopefully, more renewables and nuclear energy. Our crop yields improve, so we need less land for agriculture.
This demand for resources and land is not always driven by domestic markets. As I mentioned earlier, 14% of deforestation today is driven by consumers in rich countries.
The Forest Transition, therefore, tends to follow a ‘development’ pathway.16 As a country achieves economic growth, it moves through each of the four stages. This explains the historical trends we see in countries across the world today. Rich countries — such as the USA, France, and the United Kingdom — have had a long history of deforestation but have now passed the transition point. Most deforestation today occurs in low-to-middle-income countries.
Where are countries in the transition today?
If we look at where countries are in their transition today, we can understand where we expect to lose and gain forest in the coming decades. Most of our future deforestation is going to come from countries in the pre-or early-transition phase.
Several studies have assessed the stage of countries across the world.17 The most recent analysis to date was published by Florence Pendrill and colleagues (2019), which looked at each country’s stage in the transition, the drivers of deforestation, and the role of international trade.18 To do this, they used the standard metrics discussed in our theory of forest transitions earlier: the share of land that is forested and the annual change in forest cover.
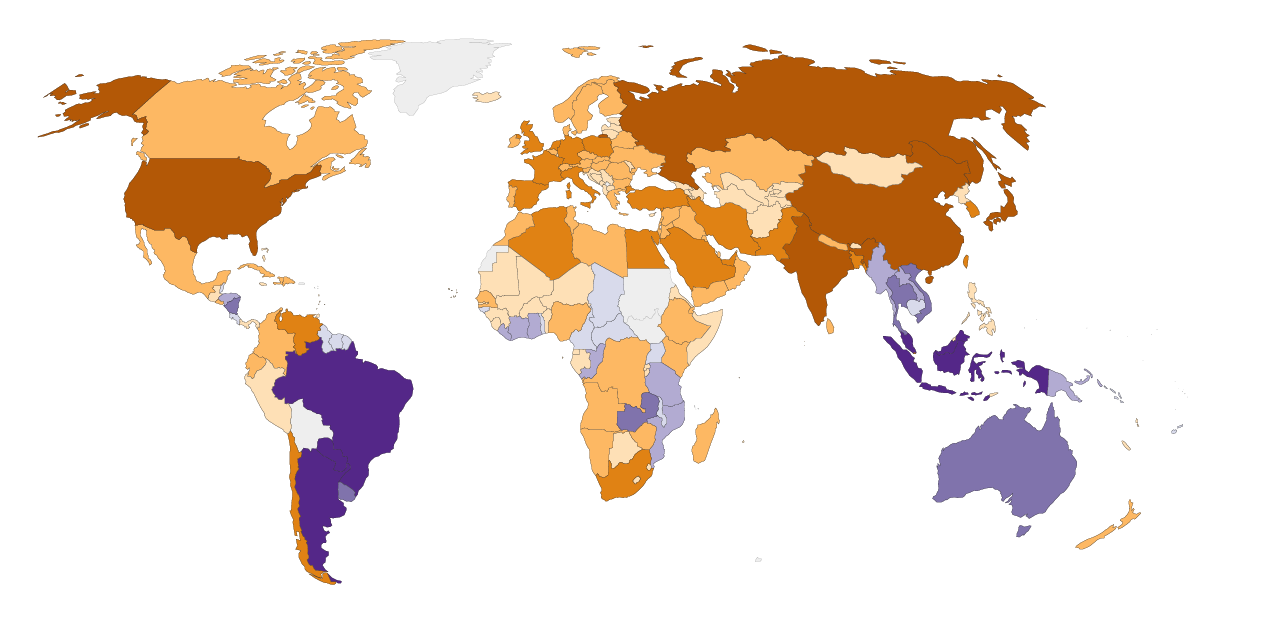
In the map, we see their assessment of each country’s stage in the transition. Most of today’s richest countries — all of Europe, North America, Japan, and South Korea — have passed the turning point and are now regaining forests. This is also true for major economies such as China and India. The fact that these countries have recently regained forests is also visible in the long-term forest trends above.
Across tropical and sub-tropical countries, we have a mix: many upper-middle-income countries are now in the late transition phase. Brazil, for example, went through a period of very rapid deforestation in the 1980s and 90s (its ‘early transition’ phase), but its losses have slowed, meaning it is now in the late transition. Countries such as Indonesia, Myanmar, and the Democratic Republic of Congo are in the early transition phase and are losing forests quickly. Some of the world’s poorest countries are still in the pre-transition phase. In the coming decades, we might expect to see the most rapid loss of forests unless these countries take action to prevent it and the world supports them in their goal.
Not all forest loss is equal: what is the difference between deforestation and forest degradation?
Fifteen billion trees are cut down every year.19 The Global Forest Watch project — using satellite imagery — estimates that global tree loss in 2019 was 24 million hectares. That’s an area the size of the United Kingdom.
These are big numbers and important ones to track: forest loss creates a number of negative impacts, ranging from carbon emissions to species extinctions and biodiversity loss. But distilling changes to this single metric — tree or forest loss — comes with its own issues.
The problem is that it treats all forest loss as equal. It assumes the impact of clearing primary rainforest in the Amazon to produce soybeans is the same as logging plantation forests in the UK. The latter will experience short-term environmental impacts but will ultimately regrow. When we cut down primary rainforest, we transform this ecosystem forever.
When we treat these impacts equally, we make it difficult to prioritize our efforts in the fight against deforestation. Decision makers could give as much of our attention to European logging as to the destruction of the Amazon. As we will see later, this would be a distraction from our primary concern: ending tropical deforestation. The other issue that arises is that ‘tree loss’ or ‘forest loss’ data collected by satellite imagery often doesn’t match the official statistics reported by governments in their land use inventories. This is because the latter only captures deforestation — the replacement of forest with another land use (such as cropland). It doesn’t capture trees that are cut down in planted forests; the land is still forested; it’s now just regrowing forests.
In the article, we will look at the reasons we lose forests, how these can be differentiated in a useful way, and what this means for understanding our priorities in tackling forest loss.
Understanding and seeing the drivers of forest loss
‘Forest loss’ or ‘tree loss’ captures two fundamental impacts on forest cover: deforestation and forest degradation.
Deforestation is the complete removal of trees for the conversion of forest to another land use such as agriculture, mining, or towns and cities. It results in a permanent conversion of forest into an alternative land use. The trees are not expected to regrow. Forest degradation measures a thinning of the canopy — a reduction in the density of trees in the area — but without a change in land use. The changes to the forest are often temporary, and it’s expected that they will regrow.
From this understanding, we can define five reasons why we lose forests:
- Commodity-driven deforestation is the long-term, permanent conversion of forests to other land uses such as agriculture (including oil palm and cattle ranching), mining, or energy infrastructure.
- Urbanization is the long-term, permanent conversion of forests to towns, cities, and urban infrastructure such as roads.
- Shifting agriculture is the small- to medium-scale conversion of forest for farming, which is later abandoned so that forests regrow. This is common in local subsistence farming systems where populations will clear forest, use it to grow crops, and then move on to another plot of land.
- Forestry production is the logging of managed, planted forests for products such as timber, paper, and pulp. These forests are logged periodically and allowed to regrow.
- Wildfires destroy forests temporarily. When the land is not converted to a new use, forests can regrow in the following years.
Thanks to satellite imagery, we can get a birds-eye view of what these drivers look like from above. In the figure, we see visual examples from the study of forest loss classification by Philip Curtis et al. (2018), published in Science.20
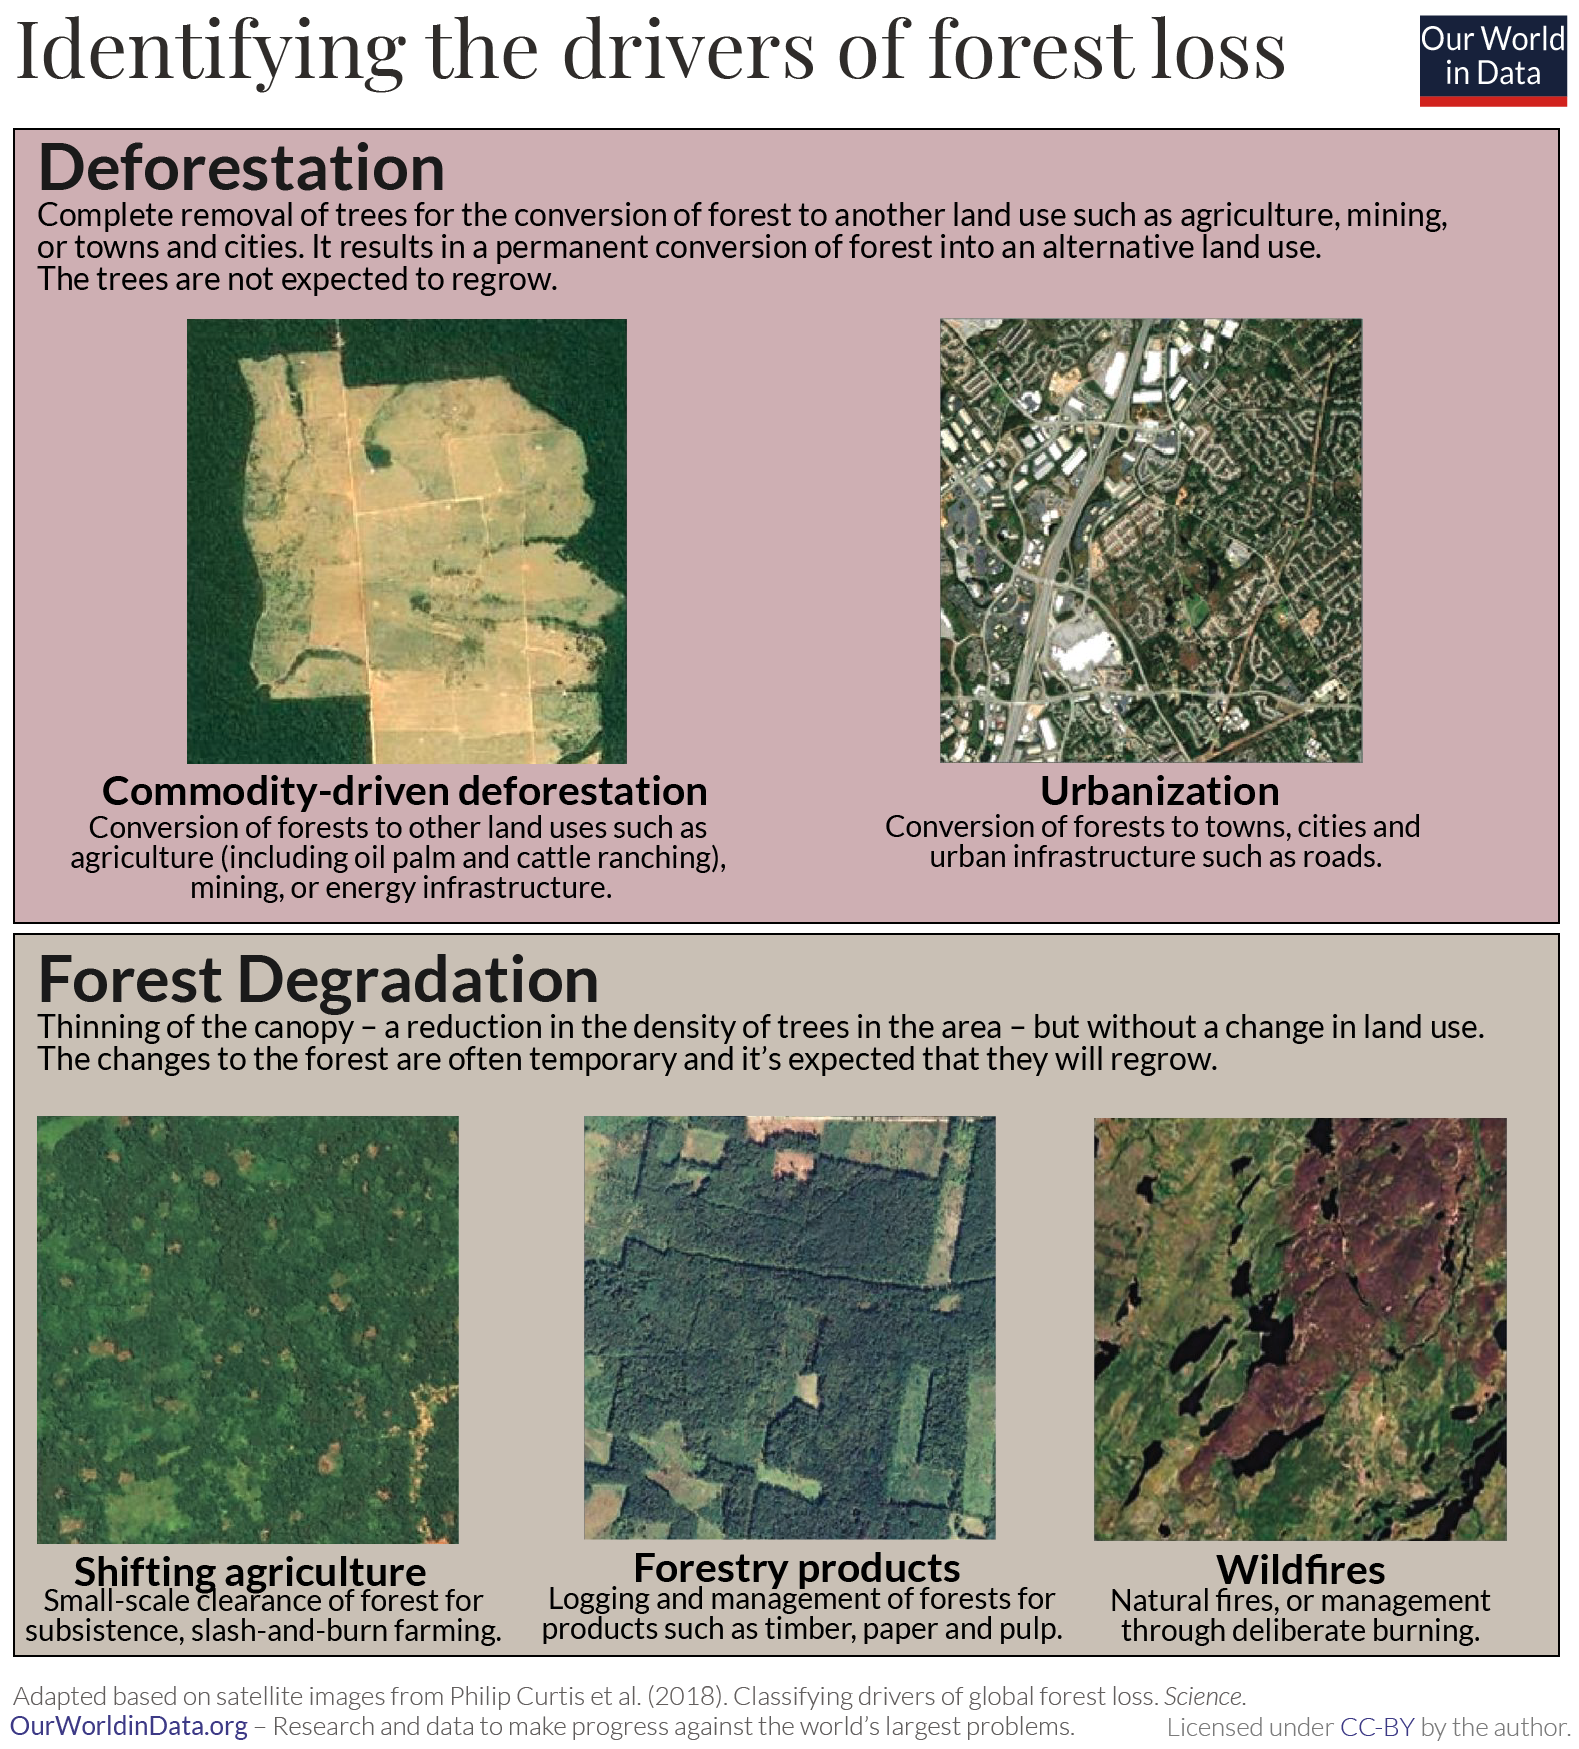
Commodity-driven deforestation and urbanization are deforestation: the forested land is completely cleared and converted into another land use — a farm, mining site, or city. The change is permanent. There is little forest left. Forestry production and wildfires usually result in forest degradation — the forest experiences short-term disturbance but, if left alone, is likely to regrow. The change is temporary. This is nearly always true of planted forests in temperate regions — there, planted forests are long-established and do not replace primary existing forests. In the tropics, some forestry production can be classified as deforestation when primary rainforests are cut down to make room for managed tree plantations.18
'Shifting agriculture’ is usually classified as degradation because the land is often abandoned, and the forests regrow naturally. But it can bridge between deforestation and degradation depending on the timeframe and permanence of these agricultural practices.
One-quarter of forest loss comes from tropical deforestation
We’ve seen the five key drivers of forest loss. Let’s put some numbers on them.
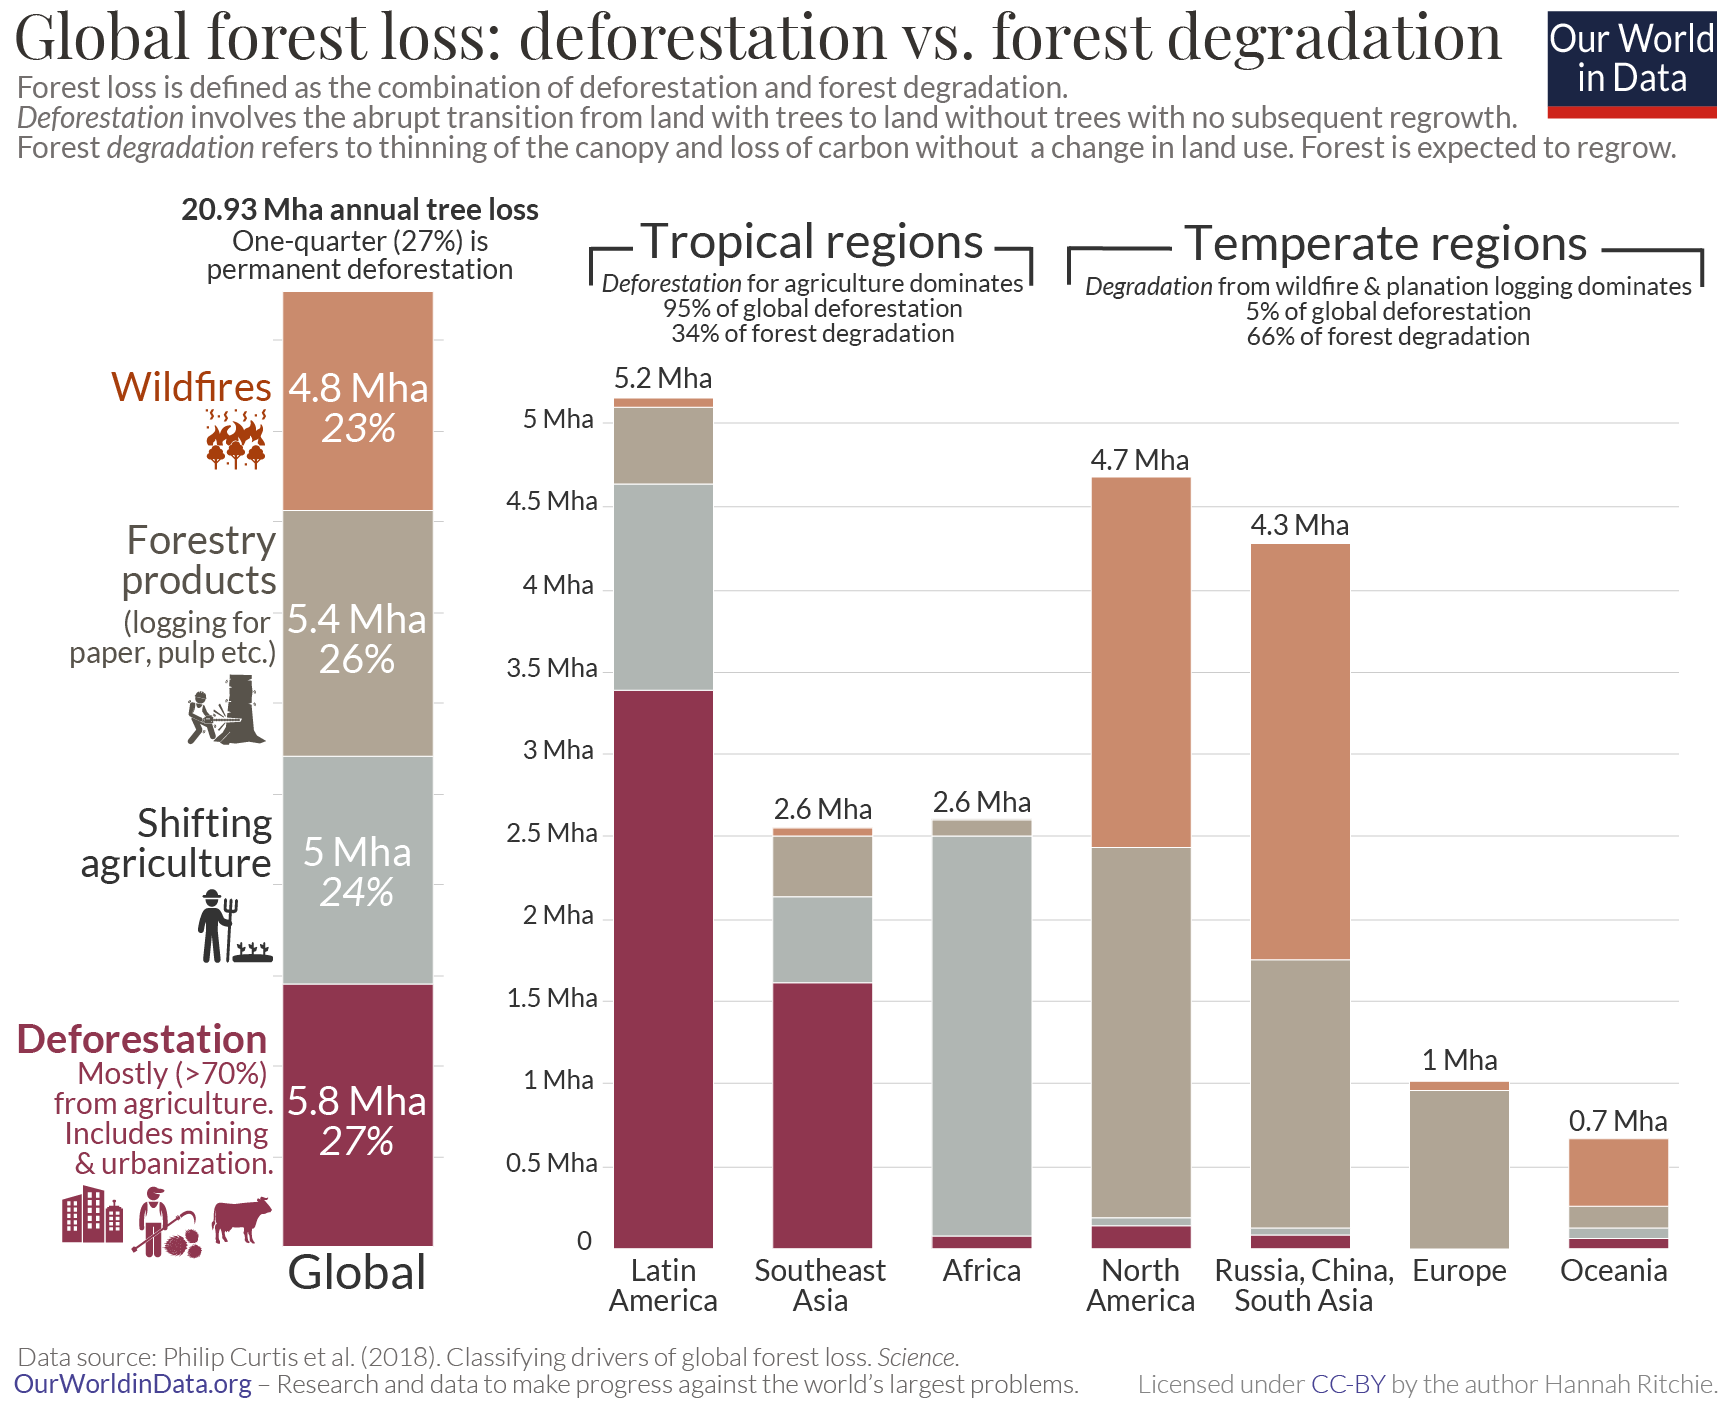
In their analysis of global forest loss, Philip Curtis and colleagues used satellite images to assess where and why the world lost forests between 2001 and 2015. The breakdown of forest loss globally and by region is shown in the chart.20
Just over one-quarter of global forest loss is driven by deforestation. The remaining 73% came from the three drivers of forest degradation: logging of forestry products from plantations (26%), shifting, local agriculture (24%), and wildfires (23%).
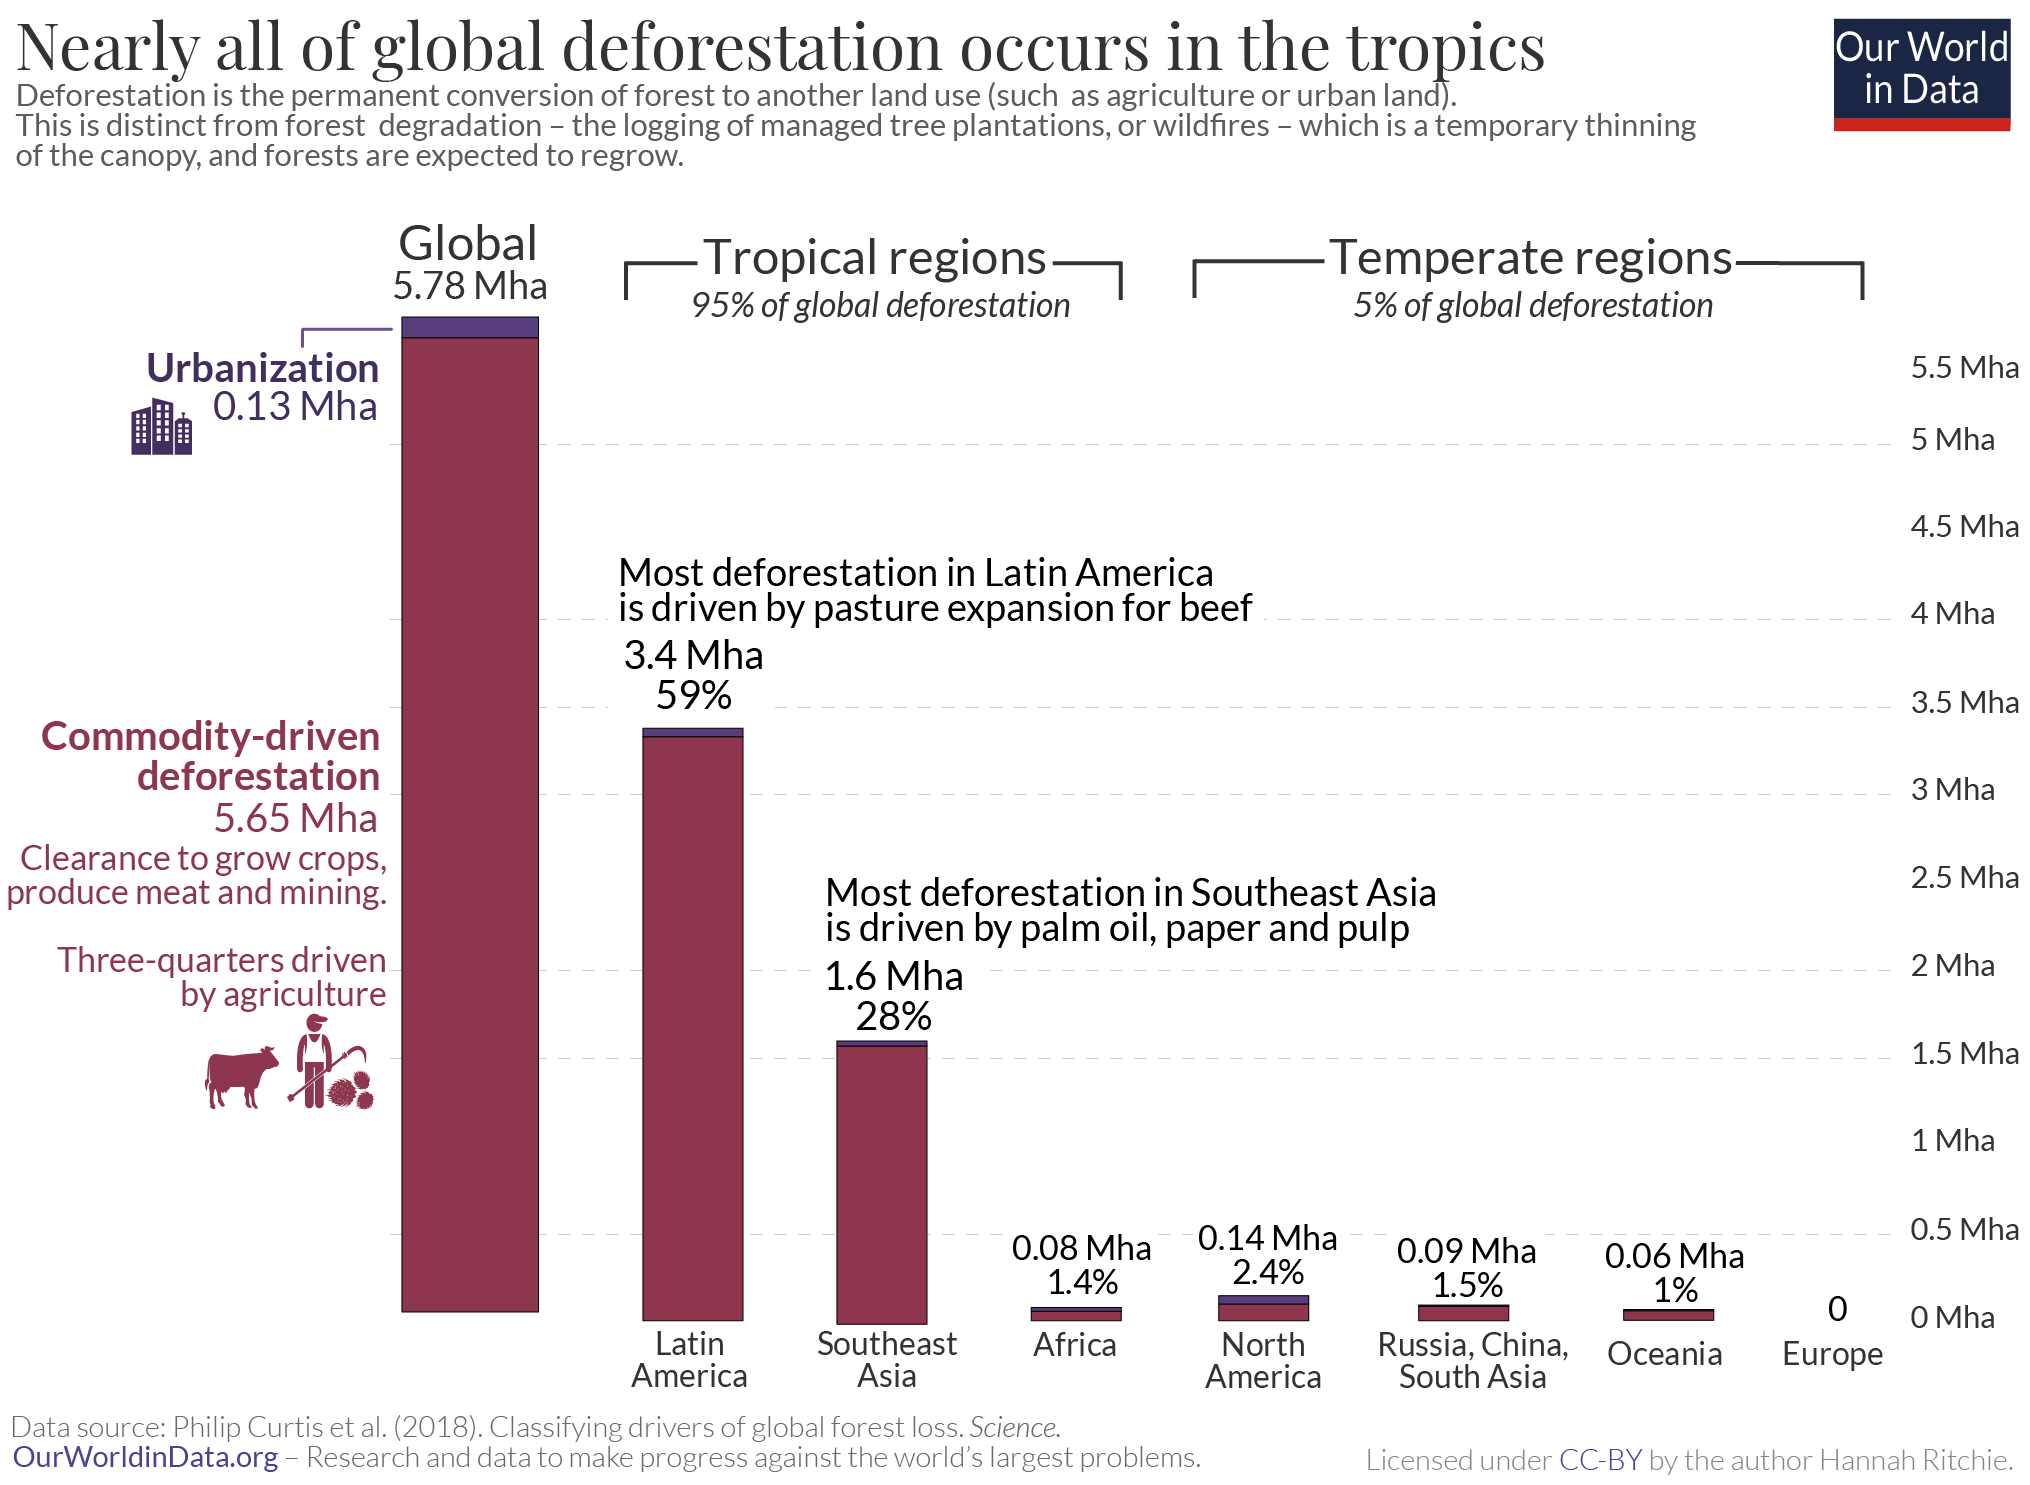
We see massive differences in how important each driver is across the world. 95% of the world’s deforestation occurs in the tropics [we look at this breakdown again later]. In Latin America and Southeast Asia, in particular, commodity-driven deforestation — mainly the clearance of forests to grow crops such as palm oil and soy and pasture for beef production — accounts for almost two-thirds of forest loss.
In contrast, most forest degradation — two-thirds of it — occurs in temperate countries. Centuries ago, it was mainly temperate regions that were driving global deforestation [we take a look at this longer history of deforestation in a related article]. They cut down their forests and replaced them with agricultural land long ago. But this is no longer the case: forest loss across North America and Europe is now the result of harvesting forestry products from tree plantations or tree loss in wildfires.
Africa is also different here. Forests are mainly cut and burned to make space for local subsistence agriculture or fuelwood for energy. This ‘shifting agriculture’ category can be difficult to allocate between deforestation and degradation: it often requires close monitoring over time to understand how permanent these agricultural practices are.
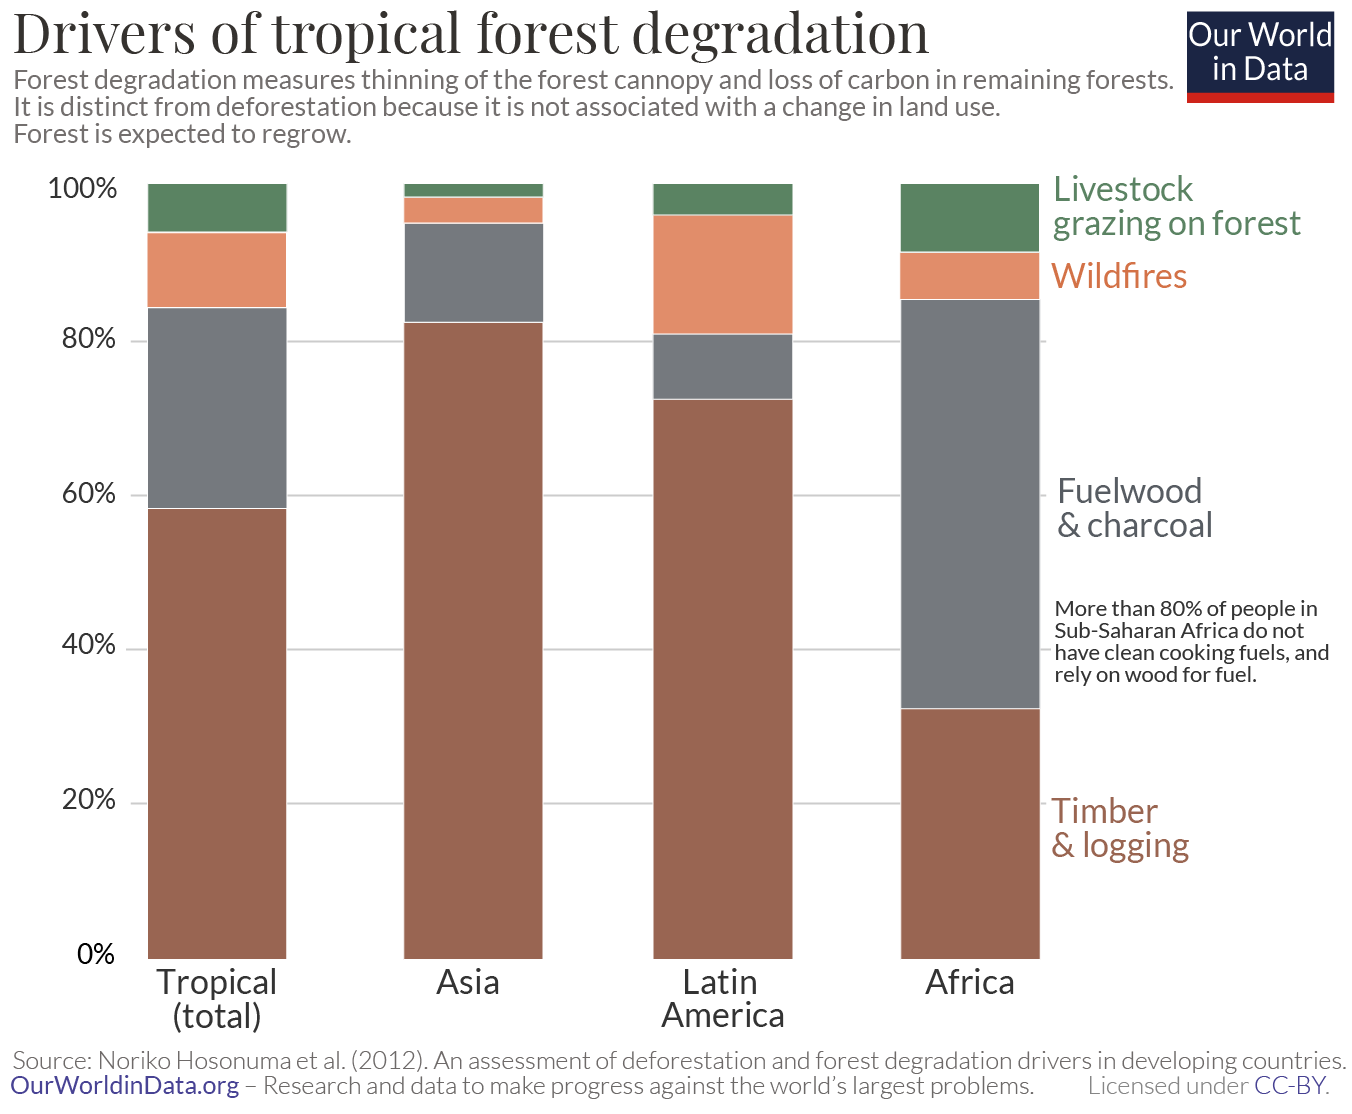
Africa is also an outlier as a result of how many people still rely on wood as their primary energy source. Noriko Hosonuma et al. (2010) looked at the primary drivers of deforestation and degradation across tropical and subtropical countries specifically.21 The breakdown of forest degradation drivers is shown in the following chart. Note that in this study, the category of subsistence agriculture was classified as a deforestation driver, so it is not included. In Latin America and Asia, the dominant driver of degradation was logging for products such as timber, paper, and pulp — this accounted for more than 70%. Across Africa, fuelwood and charcoal played a much larger role — it accounted for more than half (52%).
This highlights an important point: around one in five people in sub-Saharan Africa have access to clean fuels for cooking, meaning they still rely on wood and charcoal. With increasing development, urbanization, and access to other energy resources, Africa will shift from local subsistence activities into commercial commodity production — both in agricultural products and timber extraction. This follows the classic ‘forest transition’ model with development, which we look at in more detail in a related article.
Tropical deforestation should be our primary concern
The world loses almost six million hectares of forest each year to deforestation. That’s like losing an area the size of Portugal every two years. 95% of this occurs in the tropics. The breakdown of deforestation by region is shown in the chart. 59% occurs in Latin America, with a further 28% from Southeast Asia. In a related article, we look in much more detail at which agricultural products and which countries are driving this.
As we saw previously, this deforestation accounts for around one-quarter of global forest loss. 27% of forest loss results from ‘commodity-driven deforestation’ — cutting down forests to grow crops such as soy, palm oil, and cocoa, raising livestock on pasture, and mining operations. Urbanization, the other driver of deforestation, accounts for just 0.6%. It’s the foods and products we buy, not where we live, that have the biggest impact on global land use.
It might seem odd to argue that we should focus our efforts on tackling this quarter of forest loss (rather than the other 73%). But there is good reason to make this our primary concern.
Philipp Curtis and colleagues make this point clear. On their Global Forest Watch platform, they were already presenting maps of forest loss across the world. However, they wanted to contribute to a more informed discussion about where to focus forest conservation efforts by understanding why forests were being lost. To quote them, they wanted to prevent “a common misperception that any tree cover loss shown on the map represents deforestation.” And to “identify where deforestation is occurring; perhaps as important, show where forest loss is not deforestation.”
Why should we care most about tropical deforestation? There is a geographical argument (why the tropics?) and an argument for why deforestation is worse than degradation.
Tropical forests are home to some of the richest and most diverse ecosystems on the planet. Over half of the world’s species reside in tropical forests.22 Endemic species are those which only naturally occur in a single country. Whether we look at the distribution of endemic mammal species, bird species, or amphibian species, the map is the same: tropical and subtropical countries are packed with unique wildlife. Habitat loss is the leading driver of global biodiversity loss.23 When we cut down rainforests, we are destroying the habitats of many unique species and reshaping these ecosystems permanently. Tropical forests are also large carbon sinks and can store a lot of carbon per unit area.24
Deforestation also results in larger losses of biodiversity and carbon relative to degradation. Degradation drivers, including logging and especially wildfires, can definitely have major impacts on forest health: animal populations decline, trees can die, and CO2 is emitted. However, the magnitude of these impacts is often less than the complete conversion of forests. They are smaller and more temporary. When deforestation happens, almost all of the carbon stored in the trees and vegetation — called the ‘aboveground carbon loss’ — is lost. Estimates vary, but on average, only 10-20% of carbon is lost during logging and 10-30% from fires.25 In a study of logging practices in the Amazon and Congo, forests retained 76% of their carbon stocks shortly after logging.26 Logged forests recover their carbon over time, as long as the land is not converted to other uses (which is what happens in the case of deforestation).
Deforestation tends to occur in forests that have been around for centuries if not millennia. Cutting them down disrupts or destroys established, species-rich ecosystems. The biodiversity of managed tree plantations, which are periodically cut, regrown, cut again, and then regrown, is not the same.
That is why we should be focusing on tropical deforestation. Since agriculture is responsible for 60 to 80% of it, what we eat, where it’s sourced from, and how it is produced are our strongest levers to bring deforestation to an end.
Carbon emissions from deforestation: are they driven by domestic demand or international trade?
95% of global deforestation occurs in the tropics. Brazil and Indonesia alone account for almost half. After long periods of forest clearance in the past, most of today’s richest countries are increasing tree cover through afforestation.
This might put the responsibility for ending deforestation solely on tropical countries. But, supply chains are international. What if this deforestation is being driven by consumers elsewhere?
Many consumers are concerned that their food choices are linked to deforestation in some of these hotspots. Since three-quarters of tropical deforestation is driven by agriculture, that’s a valid concern. It feeds into the popular idea that ‘eating local’ is one of the best ways to reduce your carbon footprint. In a previous article, I showed that the types of food you eat matter much more for your carbon footprint than where it comes from — this is because transport usually makes up a small percentage of your food’s emissions, even if it comes from the other side of the world. If you want to reduce your carbon footprint, reducing meat and dairy intake — particularly beef and lamb — has the largest impact.
But understanding the role of deforestation in the products we buy is important. If we can identify the producing and importing countries and the specific products responsible, we can direct our efforts towards interventions that will really make a difference.
Read more about the imported deforestation here:
Do rich countries import deforestation from overseas?
Rich countries import foods produced on deforested land in the tropics. How much deforestation do they import?
One-third of CO2 emissions from deforestation are embedded in international trade
In a study published in Global Environmental Change, Florence Pendrill and colleagues investigated where tropical deforestation was occurring and what products were driving this. Using global trade models, they traced where these products were going in international supply chains.27
They found that tropical deforestation — given as the annual average between 2010 and 2014 — was responsible for 2.6 billion tonnes of CO2 per year. That was 6.5% of global CO2 emissions.28
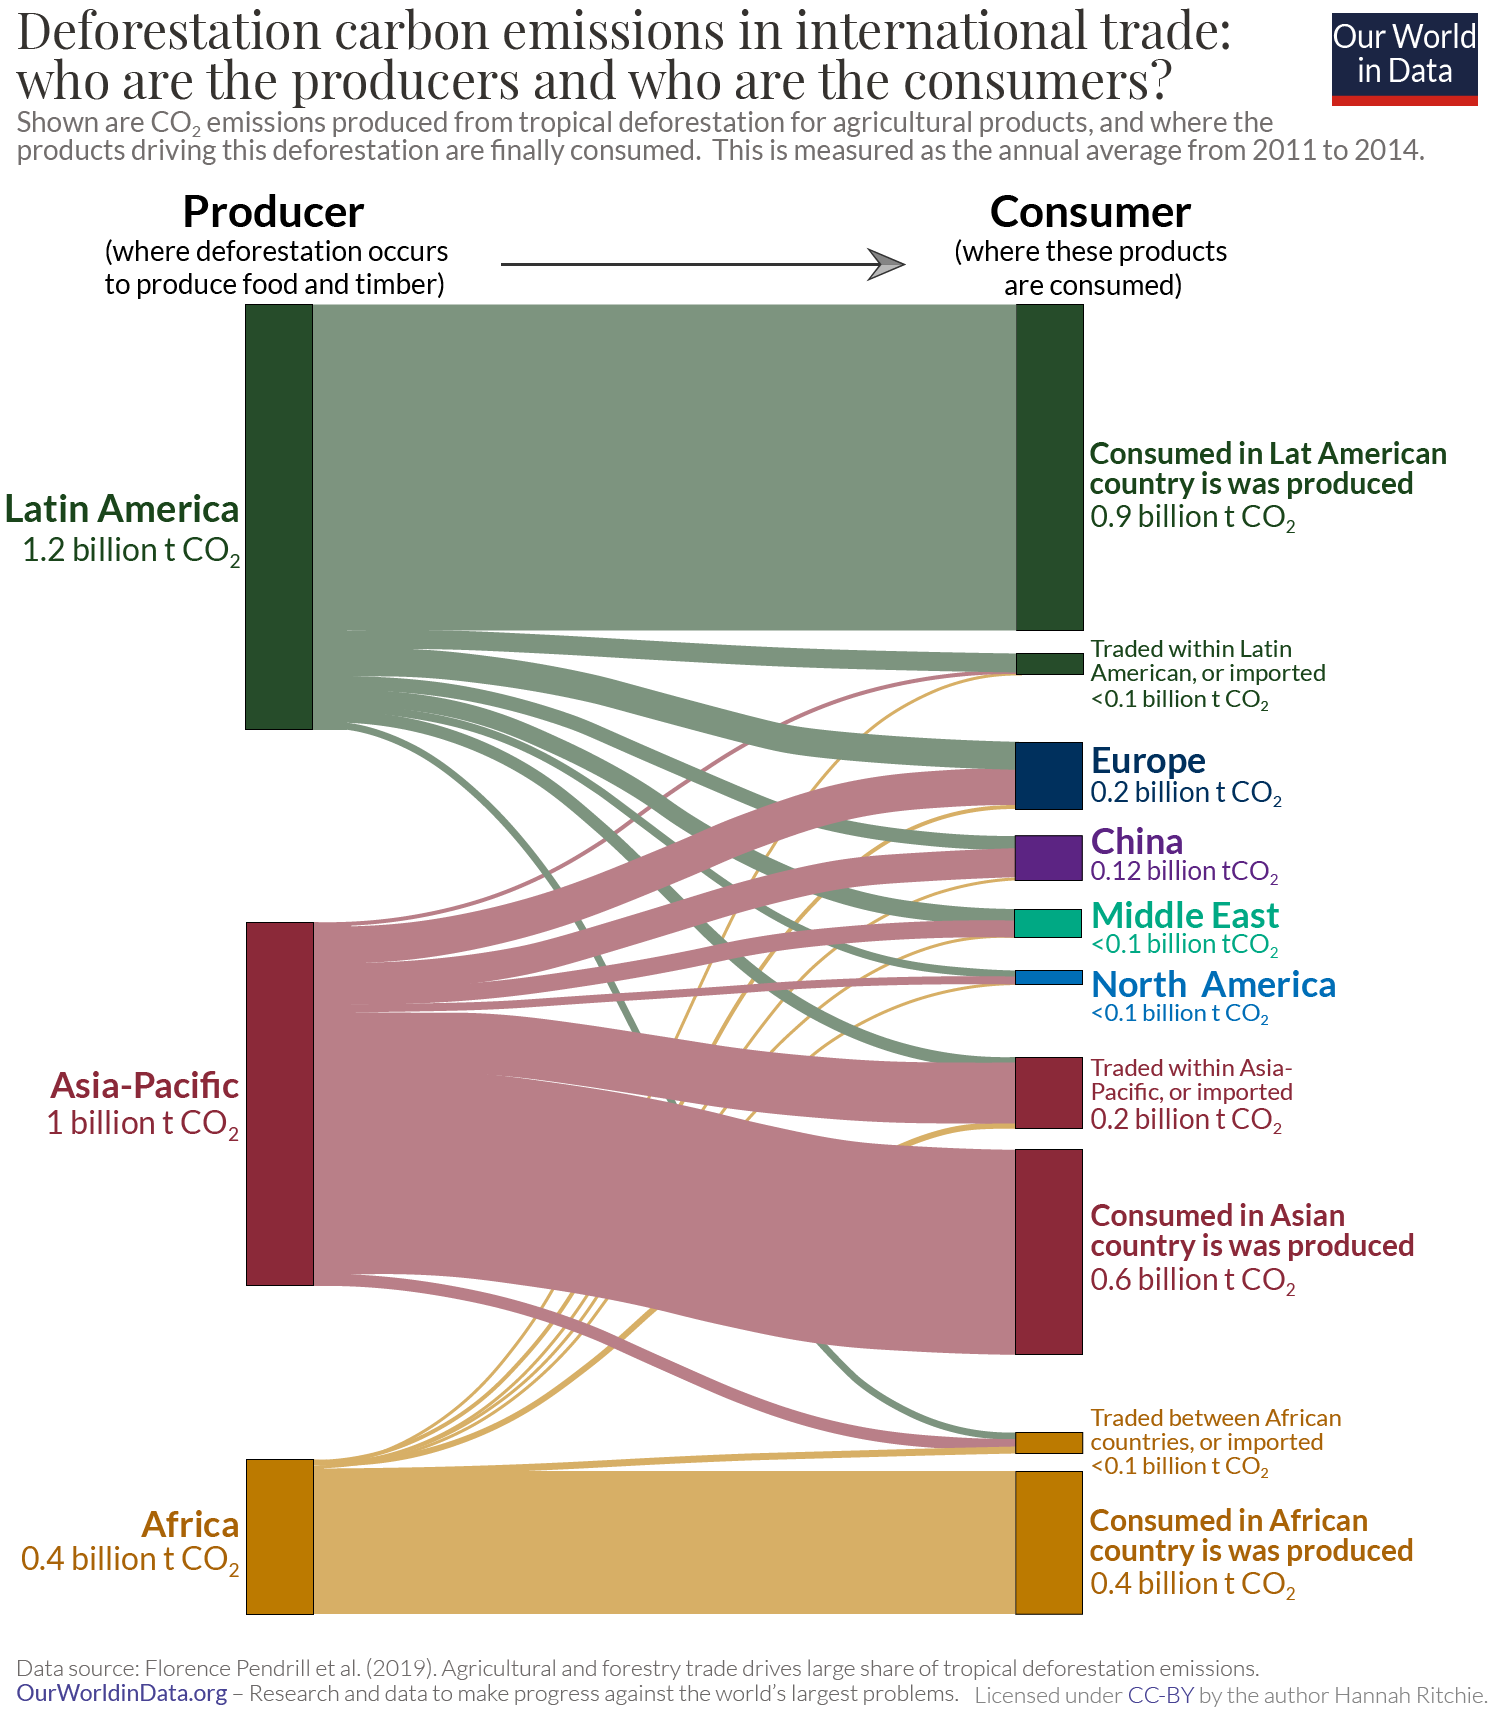
International trade was responsible for around one-third (29%) of these emissions. This is probably less than many people would expect. Most emissions — 71% — came from foods consumed in the country where they were produced. It’s domestic demand, not international trade, that is the main driver of deforestation.
In the chart, we see how emissions from tropical deforestation are distributed through international supply chains. On the left-hand side, we have the countries (grouped by region) where deforestation occurs, and on the right, we have the countries and regions where these products are consumed. The paths between these end boxes indicate where emissions are being traded — the wider the bar, the more emissions are embedded in these products.
Latin America exports around 23% of its emissions; that means more than three-quarters are generated for products that are consumed within domestic markets. The Asia-Pacific region — predominantly Indonesia and Malaysia — exports a higher share: 44%. As we will see later, this is dominated by palm oil exports to Europe, China, India, North America, and the Middle East. Deforestation in Africa is mainly driven by local populations and markets; only 9% of its emissions are exported.
Since international demand is driving one-third of deforestation emissions, we have some opportunity to reduce emissions through global consumers and supply chains. However, most emissions are driven by domestic markets, which means that policies in major producer countries will be key to tackling this problem.
How much deforestation emissions is each country responsible for?
Let’s now focus on the consumers of products driving deforestation. After we adjust for imports and exports, how much CO2 from deforestation is each country responsible for?
Rather than looking at total figures by country (if you’re interested, we have mapped them here), we have calculated the per capita footprint. This gives us an indication of the impact of the average person’s diet. Note that this only measures the emissions from tropical deforestation — it doesn’t include any other emissions from agricultural production, such as methane from livestock or rice or the use of fertilizers.
In the chart, we see deforestation emissions per person, measured in tonnes of CO2 per year. For example, the average German generated half a tonne (510 kilograms) of CO2 per person from domestic and imported foods.
At the top of the list, we see Brazil and Indonesia, which are some of the major producer countries. The fact that the per capita emissions after trade are very high means that a lot of their food products are consumed by people in Brazil and Indonesia. The diet of the average Brazilian creates 2.7 tonnes of CO2 from deforestation alone. That’s more than the country’s CO2 emissions from fossil fuels, which are around 2.2 tonnes per person.
But we also see that some countries which import a lot of food have high emissions. Luxembourg has the largest footprint at nearly three tonnes per person. Imported emissions are also high for Taiwan, Belgium, and the Netherlands at around one tonne.
The average across the EU was 0.3 tonnes of CO2 per person. To put this in perspective, that would be around one-sixth of the total carbon footprint of the average EU diet.29
Beef, soybeans, and palm oil are the key drivers of deforestation
We know where deforestation emissions are occurring and where this demand is coming from. But we also need to know what products are driving this. This helps consumers understand what products they should be concerned about and allows us to target specific supply chains.
As we covered in a previous article, 60% of tropical deforestation is driven by beef, soybean, and palm oil production. We should look not only at where these foods are produced but also at where the consumer demand is coming from.
In the chart here, we see the breakdown of deforestation emissions by product for each consumer country. The default is shown for Brazil, but you can explore the data for a range of countries using the “Change country” button.
We see very clearly that the large Brazilian footprint is driven by its domestic demand for beef. In China, the biggest driver is demand for ‘oilseeds’ — which is the combination of soy imported from Latin America and palm oil imported from Indonesia and Malaysia.
Across the US and Europe, the breakdown of products is more varied. But, overall, oilseeds and beef tend to top the list for most countries.
Bringing all of these elements together, we can focus on a few points that should help us prioritize our efforts to end deforestation. Firstly, international trade does play a role in deforestation — it’s responsible for almost one-third of emissions. By combining our earlier Sankey diagram and breakdown of emissions by-product, we can see that we can tackle a large share of these emissions through only a few key trade flows. Most traded emissions are embedded in soy and palm oil exports to China and India, as well as beef, soy, and palm oil exports to Europe. The story of both soy and palm oil is complex — and it’s not obvious that eliminating these products will fix the problem. Therefore, we look at them both individually in more detail to better understand what we can do about it.
However, international markets alone cannot fix this problem. Most tropical deforestation is driven by the demand for products in domestic markets. Brazil’s emissions are high because Brazilians eat a lot of beef. Africa’s emissions are high because people are clearing forests to produce more food. This means interventions at the national level will be key: this can include a range of solutions, including policies such as Brazil’s soy moratorium, the REDD+ Programme to compensate for the opportunity costs of preserving these forests, and improvements in agricultural productivity so countries can continue to produce more food on less land.
Endnotes
FAO. 2020. Global Forest Resources Assessment 2020 – Key findings. Rome. https://doi.org/10.4060/ca8753en
Estimates vary, but most date the end of the last ice age to around 11,700 years ago.
Kump, L. R., Kasting, J. F., & Crane, R. G. (2004). The Earth System (Vol. 432). Upper Saddle River, NJ: Pearson Prentice Hall.
Year-to-year data on forest change comes with several issues: either data at this resolution is not available, or year-to-year changes can be highly variable. For this reason, data sources — including the UN Food and Agriculture Organization — tend to aggregate annual losses as the average over five-year or decadal periods.
Williams, M. (2003). Deforesting the earth: from prehistory to global crisis. University of Chicago Press.
The data for 1990 to 2020 is from the latest assessment: the UN’s Global Forest Resources Assessment 2020.
FAO (2020). Global Forest Resources Assessment 2020: Main report. Rome. https://doi.org/10.4060/ca9825en.
Mather, A. S., Fairbairn, J., & Needle, C. L. (1999). The course and drivers of the forest transition: the case of France. Journal of Rural Studies, 15(1), 65-90.
Mather, A. S., & Needle, C. L. (2000). The relationships of population and forest trends. Geographical Journal, 166(1), 2-13.
It estimated that the net change in forests without plantations was 121 million hectares. With plantations included — as is standard for the UN’s forest assessments — this was 102 million hectares.
Hosonuma, N., Herold, M., De Sy, V., De Fries, R. S., Brockhaus, M., Verchot, L., … & Romijn, E. (2012). An assessment of deforestation and forest degradation drivers in developing countries. Environmental Research Letters, 7(4), 044009.
The area of India is around 330 million hectares. The combined losses in the 1990s and 2000s were 309 million hectares. Just 6% less than the size of India.
The area of Spain is around 51 million hectares. Double this area is around 102 million hectares — a little under 110 million hectares.
The UN Food and Agriculture Organization (FAO) Forest Resources Assessment estimates global deforestation, averaged over the five-year period from 2015 to 2020, was 10 million hectares per year.
If we sum countries’ imported deforestation by World Bank income group, we find that high-income countries were responsible for 14% of imported deforestation; upper-middle-income for 52%; lower-middle income for 23%; and low income for 11%.
Mather, A. S. (2004). Forest transition theory and the reforesting of Scotland. Scottish Geographical Journal, 120(1-2), 83-98.
England is similar: in the late 11th century, 15% of the country was forested, and over the following centuries, two-thirds were cut down. By the 19th century, the forest area had been reduced to a third of what it once was. But it was then that England reached its transition point, and since then, forests have doubled in size.
National Inventory of Woodland and Trees, England (2001). Forestry Commission. Available here.
This was first coined by Alexander Mather in the 1990s. Mather, A. S. (1990). Global forest resources. Belhaven Press.
This diagram is adapted from the work of Hosonuma et al. (2012).
Hosonuma, N., Herold, M., De Sy, V., De Fries, R. S., Brockhaus, M., Verchot, L., ... & Romijn, E. (2012). An assessment of deforestation and forest degradation drivers in developing countries. Environmental Research Letters, 7(4), 044009.
Rudel, T. K. (1998). Is there a forest transition? Deforestation, reforestation, and development. Rural Sociology, 63(4), 533-552.
Rudel, T. K., Coomes, O. T., Moran, E., Achard, F., Angelsen, A., Xu, J., & Lambin, E. (2005). Forest transitions: towards a global understanding of land use change. Global Environmental Change, 15(1), 23-31.
Cuaresma, J. C., Danylo, O., Fritz, S., McCallum, I., Obersteiner, M., See, L., & Walsh, B. (2017). Economic development and forest cover: evidence from satellite data. Scientific Reports, 7, 40678.
Noriko Hosonuma et al. (2012) looked at this distribution for low-to-middle-income subtropical countries and also studied the many drivers of forest loss.Hosonuma, N., Herold, M., De Sy, V., De Fries, R. S., Brockhaus, M., Verchot, L., ... & Romijn, E. (2012). An assessment of deforestation and forest degradation drivers in developing countries. Environmental Research Letters, 7(4), 044009.
Pendrill, F., Persson, U. M., Godar, J., & Kastner, T. (2019). Deforestation displaced: trade in forest-risk commodities and the prospects for a global forest transition. Environmental Research Letters, 14(5), 055003.
Crowther, T. W., Glick, H. B., Covey, K. R., Bettigole, C., Maynard, D. S., Thomas, S. M., ... & Tuanmu, M. N. (2015). Mapping tree density at a global scale. Nature, 525(7568), 201-205.
Curtis, P. G., Slay, C. M., Harris, N. L., Tyukavina, A., & Hansen, M. C. (2018). Classifying drivers of global forest loss. Science, 361(6407), 1108-1111.
Hosonuma, N., Herold, M., De Sy, V., De Fries, R. S., Brockhaus, M., Verchot, L., ... & Romijn, E. (2012). An assessment of deforestation and forest degradation drivers in developing countries. Environmental Research Letters, 7(4), 044009.
Hosonuma et al. (2012) gathered this data from a range of sources, including country submissions as part of their REDD+ readiness activities, Center for International Forestry Research (CIFOR) country profiles, UNFCCC national communications, and scientific studies.
Scheffers, B. R., Joppa, L. N., Pimm, S. L., & Laurance, W. F. (2012). What we know and don’t know about Earth's missing biodiversity. Trends in Ecology & Evolution, 27(9), 501-510.
Maxwell, S. L., Fuller, R. A., Brooks, T. M., & Watson, J. E. (2016). Biodiversity: The ravages of guns, nets, and bulldozers. Nature, 536(7615), 143.
Lewis, S. L. (2006). Tropical forests and the changing earth system. Philosophical Transactions of the Royal Society B: Biological Sciences, 361(1465), 195-210.
Tyukavina, A., Hansen, M. C., Potapov, P. V., Stehman, S. V., Smith-Rodriguez, K., Okpa, C., & Aguilar, R. (2017). Types and rates of forest disturbance in Brazilian Legal Amazon, 2000–2013. Science Advances, 3(4), e1601047.
Lewis, S. L., Edwards, D. P., & Galbraith, D. (2015). Increasing human dominance of tropical forests. Science, 349(6250), 827-832.
To do this, they quantified where deforestation was occurring due to the expansion of croplands, pasture, and tree plantations (for logging) and what commodities were produced on this converted land. Then, using a physical trade model across 191 countries and around 400 food and forestry products, they could trace them through to where they are physically consumed, either as food or in industrial processes.
Pendrill, F., Persson, U. M., Godar, J., Kastner, T., Moran, D., Schmidt, S., & Wood, R. (2019). Agricultural and forestry trade drives a large share of tropical deforestation emissions. Global Environmental Change, 56, 1-10.
In 2012 — the mid-year of this period — global emissions from fossil fuels, industry, and land use change was 40.2 billion tonnes. Deforestation was therefore responsible for [2.6 / 40.2 * 100 = 6.5%].
The carbon footprint of diets across the EU varies from country to country, and estimates vary depending on how much land use change is factored into these figures. Notarnicola et al. (2017) estimate that the average EU diet, excluding deforestation, is responsible for 0.5 tonnes of CO2 per person. If we add 0.3 tonnes to this figure, deforestation would account for around one-sixth [0.3 / (1.5+0.3) * 100 = 17%].
Notarnicola, B., Tassielli, G., Renzulli, P. A., Castellani, V., & Sala, S. (2017). Environmental impacts of food consumption in Europe. Journal of Cleaner Production, 140, 753-765.
Cite this work
Our articles and data visualizations rely on work from many different people and organizations. When citing this article, please also cite the underlying data sources. This article can be cited as:
Hannah Ritchie (2021) - “Deforestation and Forest Loss” Published online at OurWorldInData.org. Retrieved from: 'https://ourworldindata.org/deforestation' [Online Resource]BibTeX citation
@article{owid-deforestation,
    author = {Hannah Ritchie},
    title = {Deforestation and Forest Loss},
    journal = {Our World in Data},
    year = {2021},
    note = {https://ourworldindata.org/deforestation}
}
Reuse this work freely
All visualizations, data, and code produced by Our World in Data are completely open access under the Creative Commons BY license. You have the permission to use, distribute, and reproduce these in any medium, provided the source and authors are credited.
The data produced by third parties and made available by Our World in Data is subject to the license terms from the original third-party authors. We will always indicate the original source of the data in our documentation, so you should always check the license of any such third-party data before use and redistribution.
All of our charts can be embedded in any site.

