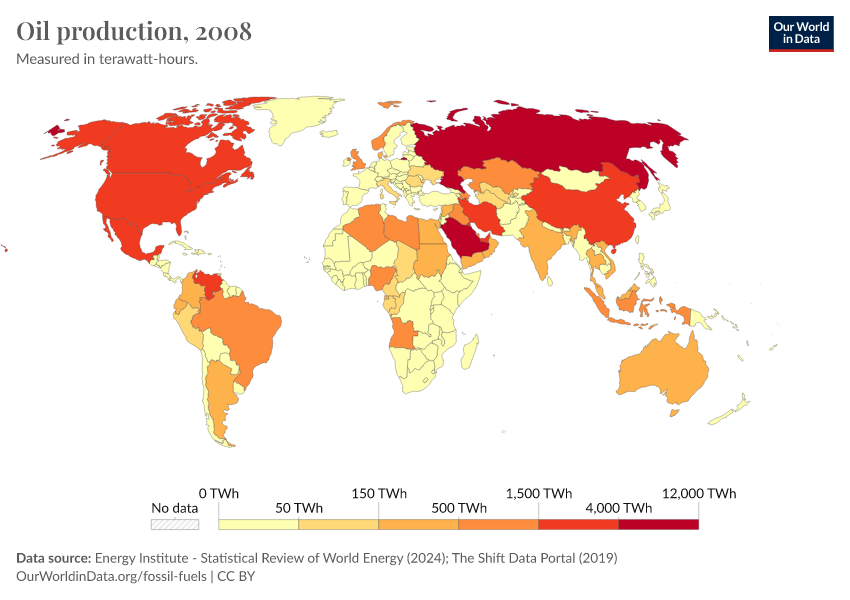
Oil production

What you should know about this indicator
Includes crude oil, shale oil, oil sands, condensates (lease condensate or gas condensates that require further refining) and NGLs (natural gas liquids - ethane, LPG and naphtha separated from the production of natural gas). Excludes liquid fuels from other sources such as biofuels and synthetic derivatives of coal and natural gas. This also excludes liquid fuel adjustment factors such as refinery processing gain. Excludes oil shales/kerogen extracted in solid form.
Related research and writing
Sources and processing
This data is based on the following sources
How we process data at Our World in Data
All data and visualizations on Our World in Data rely on data sourced from one or several original data providers. Preparing this original data involves several processing steps. Depending on the data, this can include standardizing country names and world region definitions, converting units, calculating derived indicators such as per capita measures, as well as adding or adapting metadata such as the name or the description given to an indicator.
At the link below you can find a detailed description of the structure of our data pipeline, including links to all the code used to prepare data across Our World in Data.
Notes on our processing step for this indicator
- The data is generated by combining the latest data from the Energy Institute Statistical Review of World Energy and The Shift Dataportal. The Energy Institute provides fossil fuel production data from 1965 onwards (and crude prices from 1861 onwards). The Shift Dataportal provides long-term data from 1900, but only extends to 2016. To maintain consistency with other energy data, we prioritize the Energy Institute data - meaning if they provide data for the given country and year, this data is used. Where data is not available from the Energy Institute for a given country, or pre-1965 we rely on data from The Shift Dataportal.
- We have converted primary production in exajoules to terawatt-hours using the conversion factor: 1,000,000 / 3,600 ~ 278.
- Production per capita has been calculated by dividing by our population dataset, based on different sources.
Reuse this work
- All data produced by third-party providers and made available by Our World in Data are subject to the license terms from the original providers. Our work would not be possible without the data providers we rely on, so we ask you to always cite them appropriately (see below). This is crucial to allow data providers to continue doing their work, enhancing, maintaining and updating valuable data.
- All data, visualizations, and code produced by Our World in Data are completely open access under the Creative Commons BY license. You have the permission to use, distribute, and reproduce these in any medium, provided the source and authors are credited.
Citations
How to cite this page
To cite this page overall, including any descriptions, FAQs or explanations of the data authored by Our World in Data, please use the following citation:
“Data Page: Oil production”, part of the following publication: Hannah Ritchie, Pablo Rosado and Max Roser (2023) - “Energy”. Data adapted from Energy Institute, The Shift Data Portal. Retrieved from https://ourworldindata.org/grapher/oil-production-by-country [online resource]How to cite this data
In-line citationIf you have limited space (e.g. in data visualizations), you can use this abbreviated in-line citation:
Energy Institute - Statistical Review of World Energy (2024); The Shift Data Portal (2019) – with major processing by Our World in DataFull citation
Energy Institute - Statistical Review of World Energy (2024); The Shift Data Portal (2019) – with major processing by Our World in Data. “Oil production” [dataset]. Energy Institute, “Statistical Review of World Energy”; The Shift Data Portal, “Energy production from fossil fuels” [original data]. Retrieved January 26, 2025 from https://ourworldindata.org/grapher/oil-production-by-country
