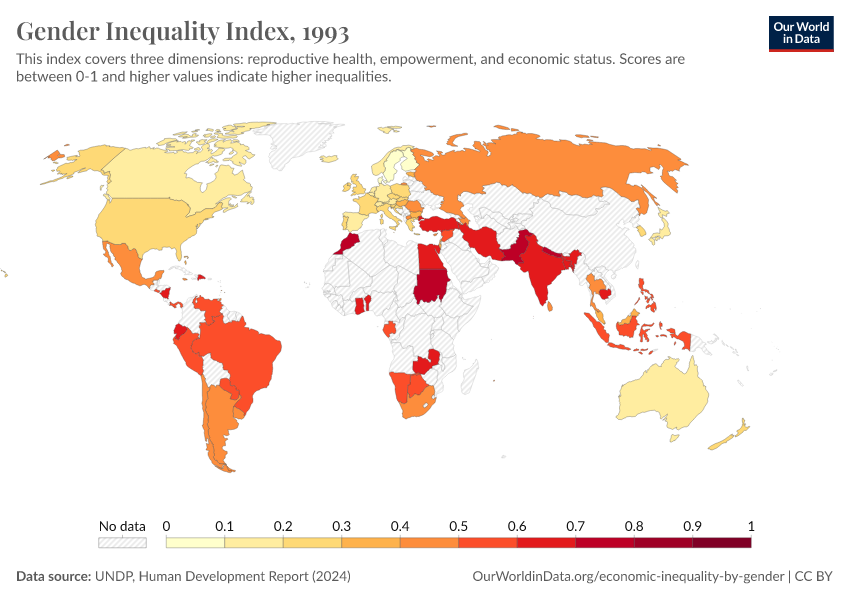
Gender Inequality Index

What you should know about this indicator
- The Gender Inequality Index (GII) reflects gender-based disadvantage in three dimensions— reproductive health, empowerment and the labour market—for as many countries as data of reasonable quality allow. It shows the loss in potential human development due to inequality between female and male achievements in these dimensions. It ranges from 0, where women and men fare equally, to 1, where one gender fares as poorly as possible in all measured dimensions.
- GII values are computed using the association-sensitive inequality measure suggested by Seth (2009), which implies that the index is based on the general mean of general means of different orders—the first aggregation is by a geometric mean across dimensions; these means, calculated separately for women and men, are then aggregated using a harmonic mean across genders.
Sources and processing
This data is based on the following sources
How we process data at Our World in Data
All data and visualizations on Our World in Data rely on data sourced from one or several original data providers. Preparing this original data involves several processing steps. Depending on the data, this can include standardizing country names and world region definitions, converting units, calculating derived indicators such as per capita measures, as well as adding or adapting metadata such as the name or the description given to an indicator.
At the link below you can find a detailed description of the structure of our data pipeline, including links to all the code used to prepare data across Our World in Data.
Notes on our processing step for this indicator
We calculated averages over continents and income groups by taking the population-weighted average of the countries in each group. If less than 80% of countries in an area report data for a given year, we do not calculate the average for that area.
Reuse this work
- All data produced by third-party providers and made available by Our World in Data are subject to the license terms from the original providers. Our work would not be possible without the data providers we rely on, so we ask you to always cite them appropriately (see below). This is crucial to allow data providers to continue doing their work, enhancing, maintaining and updating valuable data.
- All data, visualizations, and code produced by Our World in Data are completely open access under the Creative Commons BY license. You have the permission to use, distribute, and reproduce these in any medium, provided the source and authors are credited.
Citations
How to cite this page
To cite this page overall, including any descriptions, FAQs or explanations of the data authored by Our World in Data, please use the following citation:
“Data Page: Gender Inequality Index”, part of the following publication: Bastian Herre and Pablo Arriagada (2023) - “The Human Development Index and related indices: what they are and what we can learn from them”. Data adapted from UNDP, Human Development Report. Retrieved from https://ourworldindata.org/grapher/gender-inequality-index-from-the-human-development-report [online resource]How to cite this data
In-line citationIf you have limited space (e.g. in data visualizations), you can use this abbreviated in-line citation:
UNDP, Human Development Report (2024) – with minor processing by Our World in DataFull citation
UNDP, Human Development Report (2024) – with minor processing by Our World in Data. “Gender Inequality Index” [dataset]. UNDP, Human Development Report, “Human Development Report 2023-2024” [original data]. Retrieved January 27, 2025 from https://ourworldindata.org/grapher/gender-inequality-index-from-the-human-development-report
