It’s not just about child mortality, life expectancy increased at all ages
It’s often argued that life expectancy across the world has only increased because child mortality has fallen. But this is untrue. The data shows that life expectancy has increased at all ages.
It’s often argued that life expectancy across the world has only increased because child mortality has fallen. If this were true, this would mean that we’ve become much better at preventing young children from dying, but have achieved nothing to improve the survival of older children, adolescents and adults. Once past childhood, people would be expected to enjoy the same length of life as they did centuries ago.
This, as we will see in the data below, is untrue. Life expectancy has increased at all ages. The average person can expect to live a longer life than in the past, irrespective of what age they are.
Life expectancy by age in England and Wales
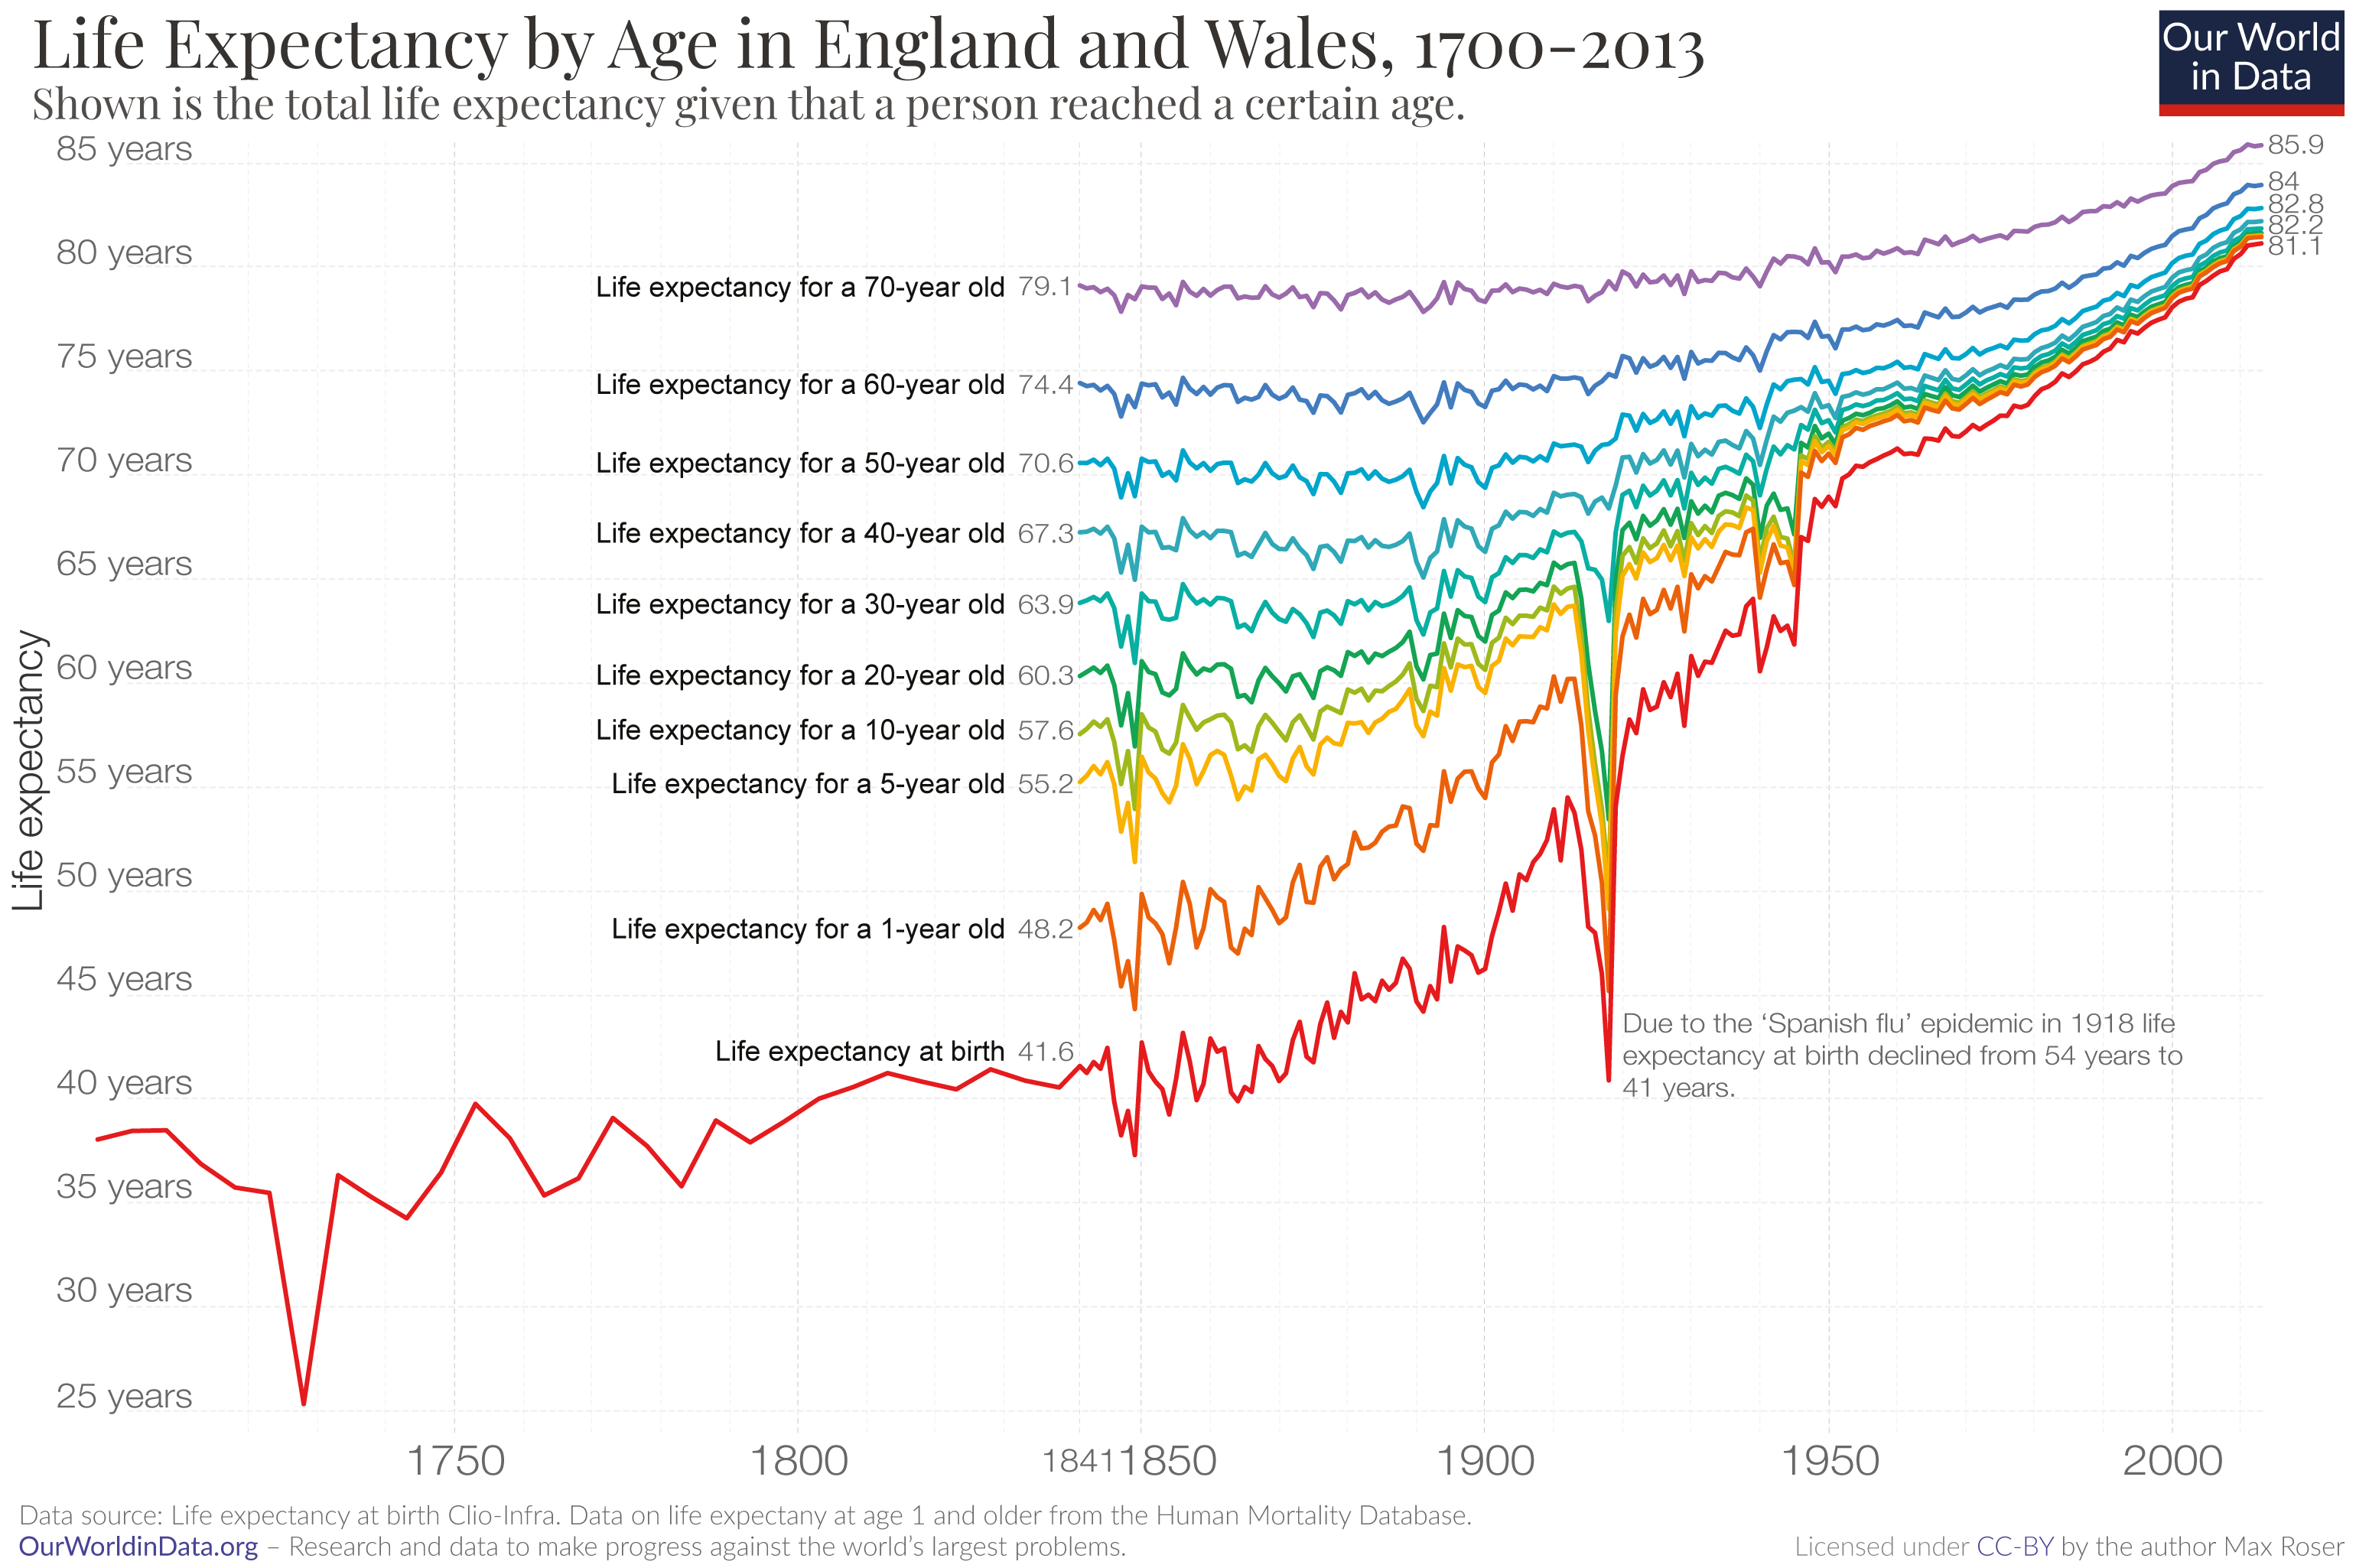
The visualization shows the life expectancy in England and Wales over the last three centuries.
The red line shows the life expectancy for a newborn. Until the mid-19th century a newborn could expect to live around 40 years. At times, even less.
The rainbow-colored lines show how long a person could expect to live once they had reached that given, older, age. The light green line, for example, represents the life expectancy for children who had reached age 10.
The most striking development we see is the dramatic increase in life expectancy since the mid-19th century. Life expectancy at birth doubled from around 40 years to more than 81 years.1 This achievement was not limited to England and Wales; since the late 19th century life expectancy doubled across all regions of the world.
While England and Wales are not the only region that achieved this improvement, the last 150 years are the only time that humanity achieved anything like this. The evidence that we have for population health before modern times suggest that around a quarter of all infants died in the first year of life and almost half died before they reached the end of puberty (see here) and there was no trend for life expectancy before the modern improvement in health: In the centuries preceding this chart, life expectancy fluctuated between 30 and 40 years with no marked increase ever.

Life expectancy increased at all ages
A common criticism of the statement that life expectancy doubled is that this “only happened because child mortality declined”. I think that, even if this were true, it would be one of humanity’s greatest achievements, but in fact, this assertion is also just plain wrong. Mortality rates declined, and consequently life expectancy increased, for all age groups.
The data shown in this chart makes this clear.
Let's see how life expectancy has improved without taking the massive improvements in child mortality into account. Child mortality is defined as the share of children who die before reaching their 5th birthday. We therefore have to look at the life expectancy of a five-year-old to see how mortality changed without taking child mortality into account. This is shown by the yellow line. In 1841 a five-year-old could expect to live 55 years. Today a five-year-old can expect to live 82 years. An increase of 27 years.
The same is true for any higher age cut-off. A 50-year-old, for example, could once expect to live up to the age of 71. Today, a 50-year-old can expect to live to the age of 83. A gain of 13 years.
This is true for countries around the world. Here is the data for the life expectancy of 15-year-olds around the world.
A second striking feature of this visualization is the big decline of life expectancy in 1918. It was caused by a very large global influenza epidemic, the Spanish flu pandemic. I have studied the impact of this pandemic and especially it’s differential impact for different age-groups – the life expectancy of older people barely changed as the chart shows – in a text on the this pandemic here.
Yes, the decline of child mortality matters a lot for life expectancy. But as we’ve seen, the gains go much further than this. As we have seen here it was not only children that benefited from this progress, but people at all ages.

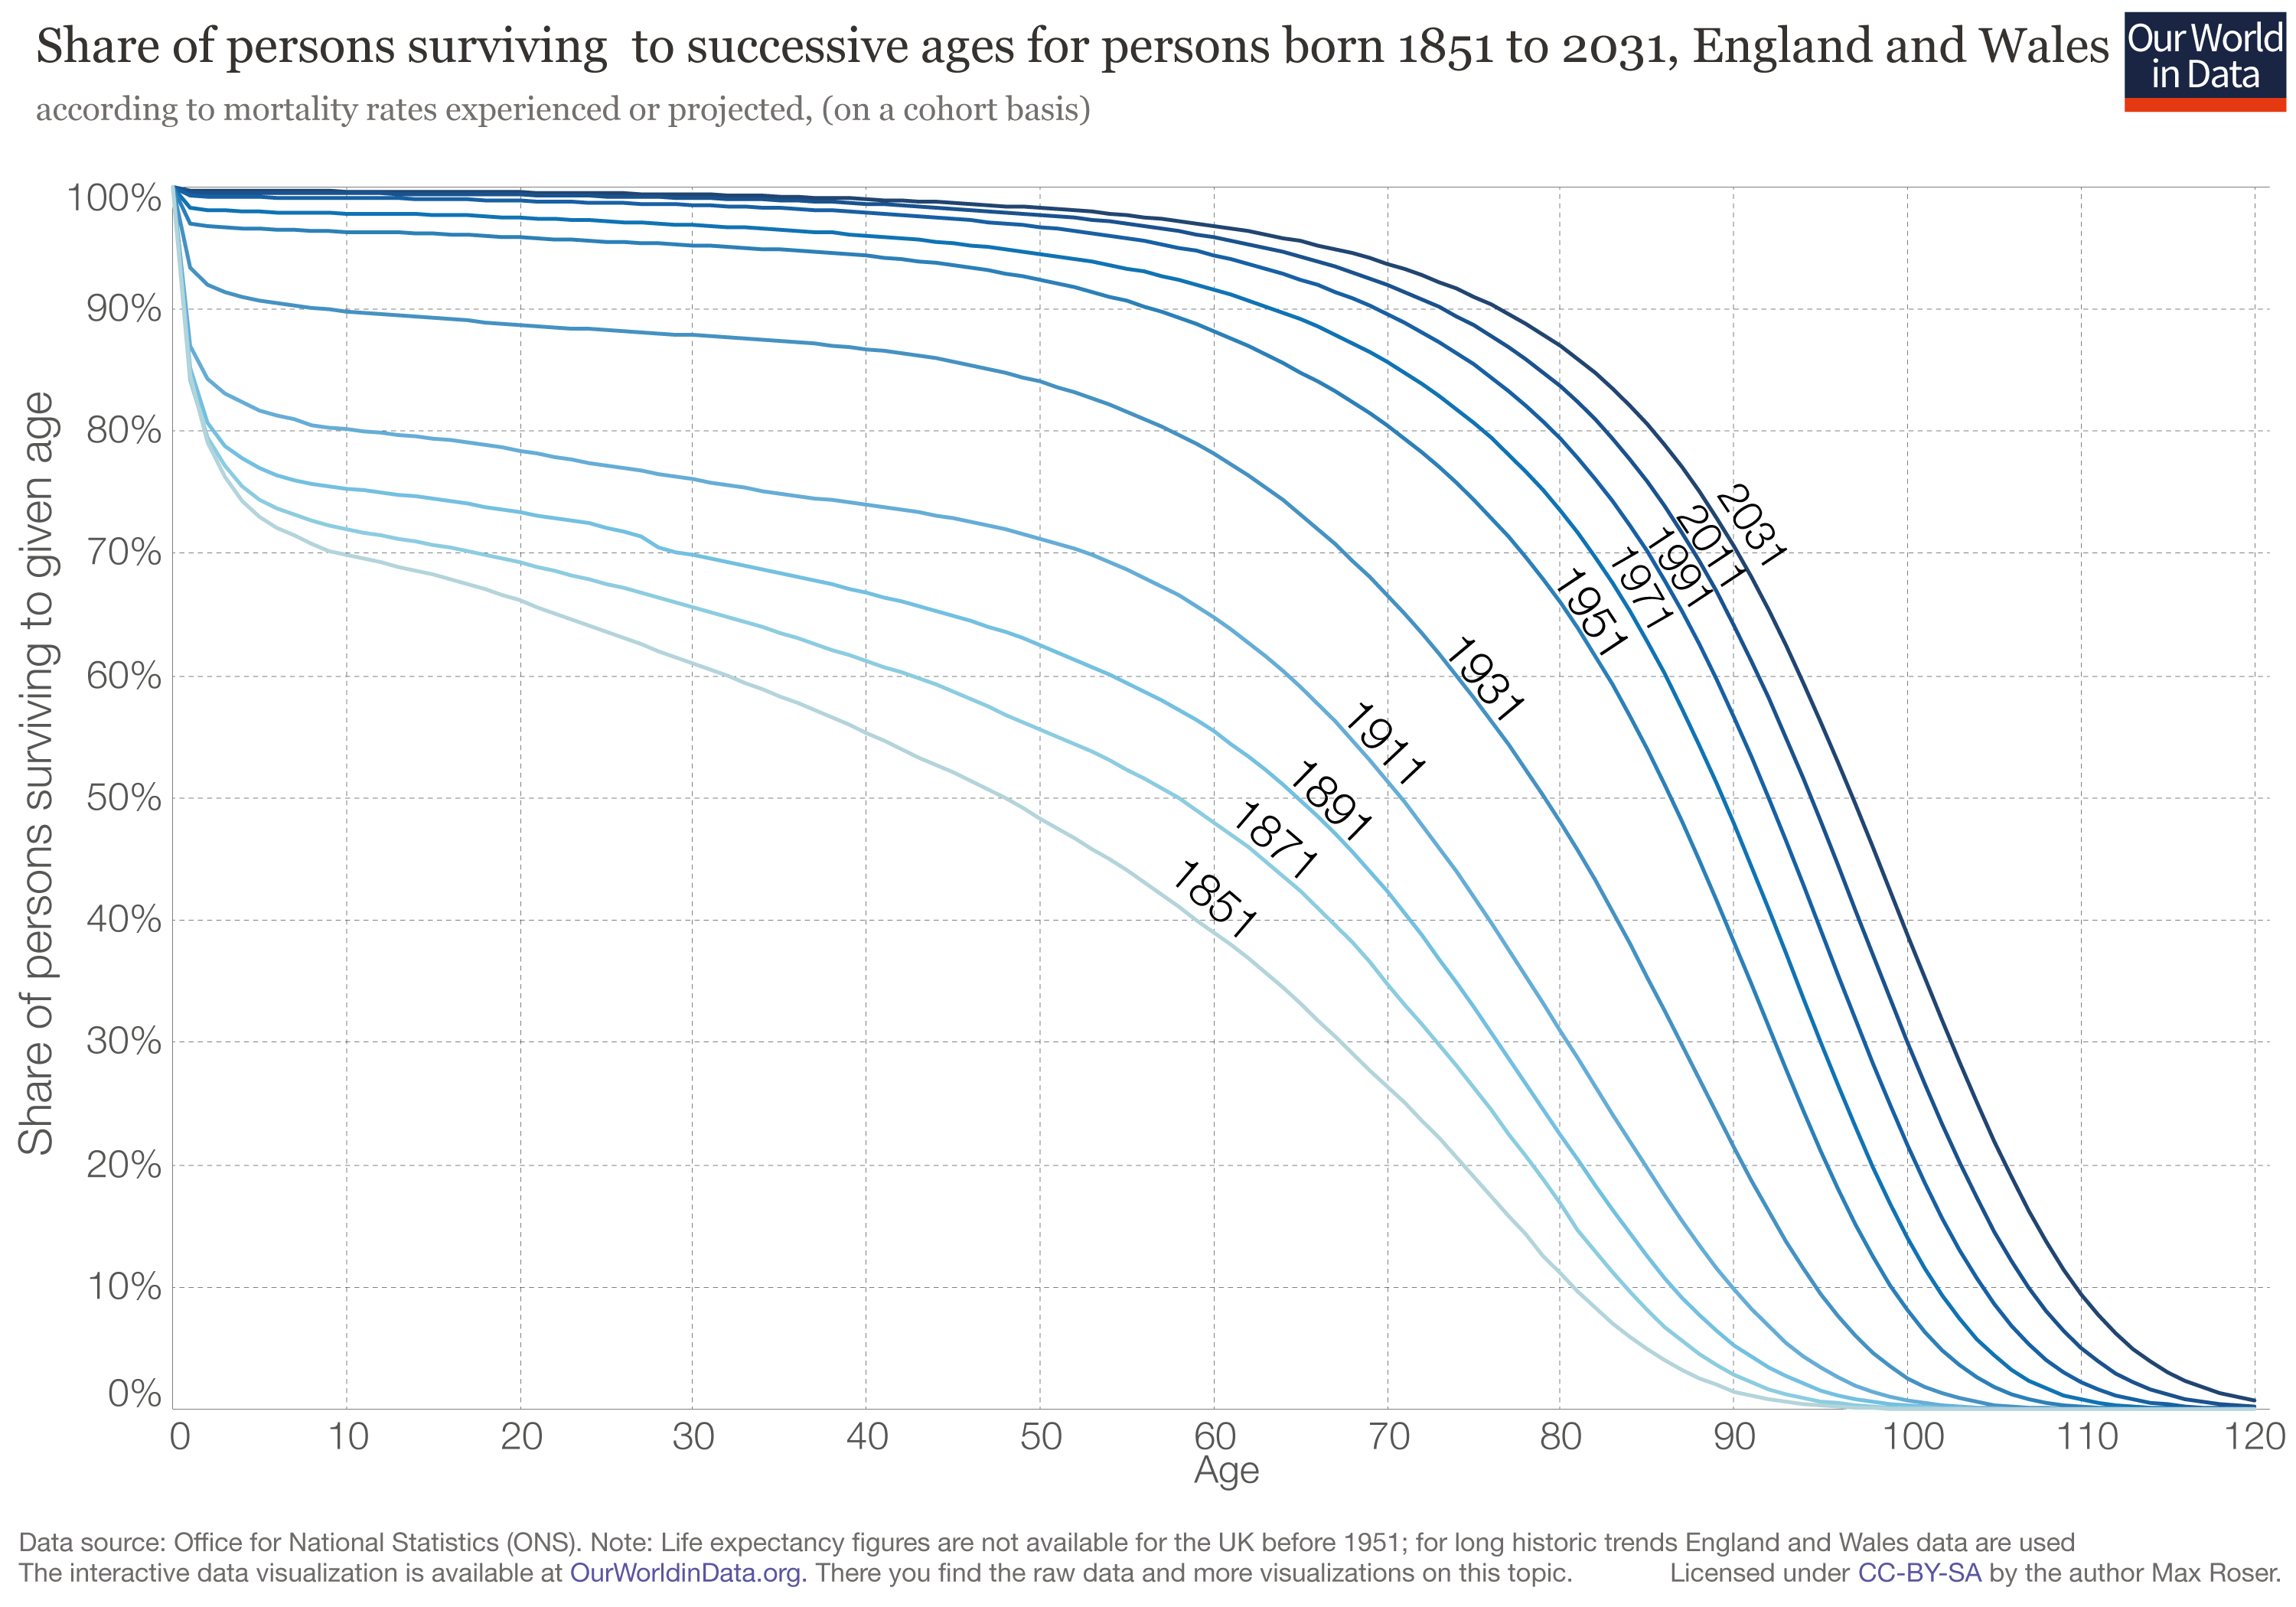
Another perspective: Survival curves
In our entry on life expectancy you find another perspective on the same data.
Endnotes
The latest data on life expectancy in England and Wales can be found at the Office for National Statistics here. At the time of writing, data beyond 2014 are only available as projections.
Cite this work
Our articles and data visualizations rely on work from many different people and organizations. When citing this article, please also cite the underlying data sources. This article can be cited as:
Max Roser (2020) - “It’s not just about child mortality, life expectancy increased at all ages” Published online at OurWorldinData.org. Retrieved from: 'https://ourworldindata.org/its-not-just-about-child-mortality-life-expectancy-improved-at-all-ages' [Online Resource]BibTeX citation
@article{owid-its-not-just-about-child-mortality-life-expectancy-improved-at-all-ages,
    author = {Max Roser},
    title = {It’s not just about child mortality, life expectancy increased at all ages},
    journal = {Our World in Data},
    year = {2020},
    note = {https://ourworldindata.org/its-not-just-about-child-mortality-life-expectancy-improved-at-all-ages}
}
Reuse this work freely
All visualizations, data, and code produced by Our World in Data are completely open access under the Creative Commons BY license. You have the permission to use, distribute, and reproduce these in any medium, provided the source and authors are credited.
The data produced by third parties and made available by Our World in Data is subject to the license terms from the original third-party authors. We will always indicate the original source of the data in our documentation, so you should always check the license of any such third-party data before use and redistribution.
All of our charts can be embedded in any site.

