Gdoc/Admin

Popular pages

Research and data to make progress against the world’s largest problems.

13,171 charts across 120 topicsAll free: open access and open source

Our Mission

What do we need to know to make the world a better place?

To make progress against the pressing problems the world faces, we need to be informed by the best research and data.

Our World in Data makes this knowledge accessible and understandable, to empower those working to build a better world.

Read about our mission

We are a non-profit — all our work is free to use and open source. Consider supporting us if you find our work valuable.

Donate to support us
As seen on
Logos of the publications that have used our content. From left to right: Science, Nature, PNAS, BBC, Financial Times, The New York Times, The Guardian, The Atlantic, and The Washington Post

Daily Data Insights

Bite-sized insights on how the world is changing, published every weekday.

See all Daily Data Insights
A graph titled "Internet usage has surged in Asia's four most populous countries" shows the percentage of the population that used the Internet in the last three months across four countries: China, India, Indonesia, and Pakistan. 

- In China, the percentage increased from 2% in 2000 to 77% in 2023, with a steadily rising line.
- India shows a rise from 1% in 2000 to 43% in 2023, with a gradual upward trend.
- Indonesia's internet usage jumped from 1% in 2000 to 69% in 2023, following a similar growth pattern.
- Pakistan also increased its usage from 1% in 2000 to 33% in 2023, showcasing an upward trend.

At the bottom, there is a note indicating the data source is the International Telecommunication Union via the World Bank, along with additional information that India's latest data is from 2020 and Pakistan's is from 2022. The graphic has a Creative Commons BY attribution.

Internet use has grown rapidly but unevenly across Asia's largest countries

Since the turn of the millennium, Internet access has grown quickly but at different rates across Asia’s most populous nations.

Four countries, home to more than 40% of the world's population, tell this story in the chart: China, India, Indonesia, and Pakistan.

Internet users in China rose from 2% in 2000 to 77% in 2023, while Indonesia’s users grew from 1% to 69%. The pace has been slower in South Asia, with India reaching 43% by 2020 and Pakistan 33% by 2022.

Explore Internet usage for more countries

Continue reading
A global map shows the share of mothers aged 20–44 who have lost a child under five years old. The data is categorized into four ranges: less than 1% (light yellow), 1% to 5% (yellow), 5% to 10% (orange), 10% to 30% (dark orange), and more than 30% (red). Higher rates are concentrated in Sub-Saharan Africa and parts of South Asia, while lower rates are seen in North America, Europe, and parts of East Asia. Data is sourced from Smith-Greenaway et al. (2021) and reflects single-year estimates between 2010 and 2018.

In some countries, more than one in three mothers have lost a child younger than five

There are few experiences, if any, that are more painful for a parent than losing a child.

In the past, child deaths were much more common than they are today. But even when these deaths were not unusual, historical diary entries show us that most parents still found them heartbreaking.

Unfortunately, in many countries today, a large share of parents still experience the loss of a child. The map here shows the share of mothers who lost a child before they reached the age of five.

In most of Europe and North America, this share is less than 1%. But in some of the world’s poorest countries — like Cameroon, Nigeria, and the Central African Republic — more than one in three mothers have experienced this tragedy.

These figures come from a research article by Emily Smith-Greenaway and colleagues, based on reported or estimated data from 2010 to 2018 for mothers aged 20 to 44.

Read my colleague Max Roser’s article for more historical context around this data →

Continue reading
The image presents a data visualization illustrating the number of animals killed for meat worldwide from 1961 to 2022. It is divided into four sections, each representing a different animal species:

1. **Chickens**: Shown in orange, the graph starts at zero in 1961 and rises sharply, reaching approximately 60 billion killed by 2022.
  
2. **Pigs**: Displayed in green, this chart shows a more gradual increase, starting from zero in 1961 and peaking at around 1 billion killed by 2022.

3. **Sheep and Goats**: Presented in blue, this line shows a steady rise from zero in 1961 to nearly 400 million by 2022, with a peak near 1 billion.

4. **Cows**: Illustrated in dark green, this graph shows a slow but consistent increase from zero to about 300 million killed by 2022.

Each section has a label indicating the species and the number of animals on the vertical axis, while the horizontal axis marks the years from 1961 to 2022. The bottom of the image references the data source as the Food and Agriculture Organization of the UN from 2023, with a CC BY attribution.

More land animals than ever before are slaughtered for meat

Global livestock numbers — tracked by the UN Food and Agriculture Organization since 1961 — have surged, with particularly large increases in the number of chickens, pigs, sheep, goats, and cows.

For many land animals, life is short and painful. Recent estimates indicate that globally, most animals are raised on factory farms. In the US, where better data and research are available, 99% of livestock is factory-farmed.

Explore many more interactive charts and articles on animal welfare

Continue reading
A bar chart titled "Global sales of combustion engine cars have peaked," showing annual car sales from 2010 to 2023. The chart highlights that combustion engine car sales peaked in 2017/18 and have declined since, while electric car sales (in orange) have steadily risen. Total car sales hover around 70–80 million annually, with electric cars making a growing share of the market from 2018 onward. Data source: International Energy Agency, Global EV Outlook 2024. Note: Electric cars include fully battery-electric and plug-in hybrids.

Global sales of combustion engine cars have peaked

To decarbonize road transport, the world must move away from petrol and diesel cars and towards electric vehicles and other forms of low-carbon transport.

This transition has already started. In fact, global sales of combustion engine cars are well past the peak and are now falling.

As you can see in the chart, global sales peaked in 2018. This is calculated based on data from the International Energy Agency. Bloomberg New Energy Finance estimates this peak occurred one year earlier, in 2017.

Sales of electric cars, on the other hand, are growing quickly.

Explore more data on electric car sales across the world →

Continue reading
A data visualization titled "Nine Asian countries where child mortality has halved since 2000." The chart shows the estimated percentage of newborns dying before age five in nine countries: Afghanistan (13% in 2000 to 6% in 2022), Cambodia (11% to 2%), Laos (11% to 4%), Bangladesh (9% to 3%), Myanmar (9% to 4%), India (9% to 3%), Nepal (8% to 3%), Indonesia (5% to 2%), and China (4% to 1%). Each country is represented by a line graph showing a significant decline in child mortality over time. Data source: UN Inter-agency Group for Child Mortality Estimation (2024), CC BY.

In these nine Asian countries, child mortality has more than halved since the year 2000

Child mortality in Asia has fallen sharply. The chart shows nine countries that have reduced child mortality rates by more than half since 2000. This means millions more children surviving through the crucial early years of life.

In India, for example, child mortality fell from 9% to 3%. China saw a similar decrease from 4% to just 1%. Key reasons for these gains include improved nutrition, clean water, sanitation, vaccinations, and poverty reduction.

However, even with these improvements, rates of 1–6% still reflect hundreds of thousands of young lives lost each year in these countries.

This is a story of remarkable progress — but one that’s not yet finished.

Explore child mortality data for more countries

Continue reading
An infographic titled "Most livestock in the United States are factory-farmed." It lists the percentages and numbers of animals raised in factory farms, defined by the EPA as operations with intensive feeding for over 45 days. Chickens: 99.96%, 9.2 billion; Turkeys: 99.8%, 260 million; Farmed fish: 100%, 530 million; Cows: 75%, 66 million; Egg-laying hens: 98.3%, 380 million; Pigs: 98.6%, 73 million. Data source: Sentience Institute (2024), with data from 2022.

Almost all livestock in the United States is factory-farmed

It’s difficult to quantify animal suffering in a single number, but one metric often used to measure living conditions is the number of animals raised on “factory farms”.

Factory farms are defined as “concentrated animal feeding operations” where many animals are held in an intensive feeding operation for more than 45 days.

99% of livestock in the United States is factory-farmed. This latest estimate comes from the Sentience Institute and is based on definitions and data from the US Environment Protection Agency.

The chart shows the share of different forms of livestock that are factory-farmed. More than 98% of chickens, turkeys, hens, pigs, and farmed fish are factory-farmed. Cows are a bit less likely to be factory-farmed, but three-quarters still spend much of their lives in these conditions.

Read more about factory farming, including estimates of how much livestock globally is factory-farmed →

Continue reading
A line graph depicting the most common birth month in France from 1861 to 2022, with the horizontal axis representing months from January to December and the vertical axis indicating years. Each year shows a line indicating the month with the highest average birth rate per day, with varying colors representing different time periods. 

In the late 19th and early 20th centuries, lines often cluster around spring months, indicating this as the most common season for births. Disruptions during World Wars I and II are noted, as birth rates shifted temporarily. Since the late 20th century, the trend has changed, with late summer and autumn months becoming the most common for births.

The data source is the Human Mortality Database (2024) and the chart is published on OurWorldinData.org, and is licensed under CC-BY by the authors, Saloni Dattani and Lucas Rodés-Guirao.

Spring no more: France’s shift in birth patterns

What’s the most common season for babies to be born?

In many European countries, it’s late summer or autumn. Births are 5% to 10% more common in these months than others.

But this seasonal pattern used to be different. The chart shows the most common month for births each year. We’ve focused on France, which has data since the 1860s.

As you can see, spring was the most common season for births then. The pattern was temporarily disrupted during the two World Wars but continued until the late 20th century. Then, births shifted to later in the year, with late summer and autumn becoming more popular.

This shift also occurred in many other European countries and North America.

Explore the most common birth month around the world

Continue reading

Get Daily Data Insights delivered to your inbox

Receive an email from us when we publish a Daily Data Insight (every weekday).

By subscribing you are agreeing to the terms of our privacy policy.

Explore our data

Featured data from our collection of 13,171 interactive charts.

See all our data

What share of children die before their fifth birthday?

What could be more tragic than the death of a young child? Child mortality, the death of children under the age of five, is still extremely common in our world today.

The historical data makes clear that it doesn’t have to be this way: it is possible for societies to protect their children and reduce child mortality to very low rates. For child mortality to reach low levels, many things have to go right at the same time: good healthcare, good nutrition, clean water and sanitation, maternal health, and high living standards. We can, therefore, think of child mortality as a proxy indicator of a country’s living conditions.

The chart shows our long-run data on child mortality, which allows you to see how child mortality has changed in countries around the world.

Explore and learn more about this data

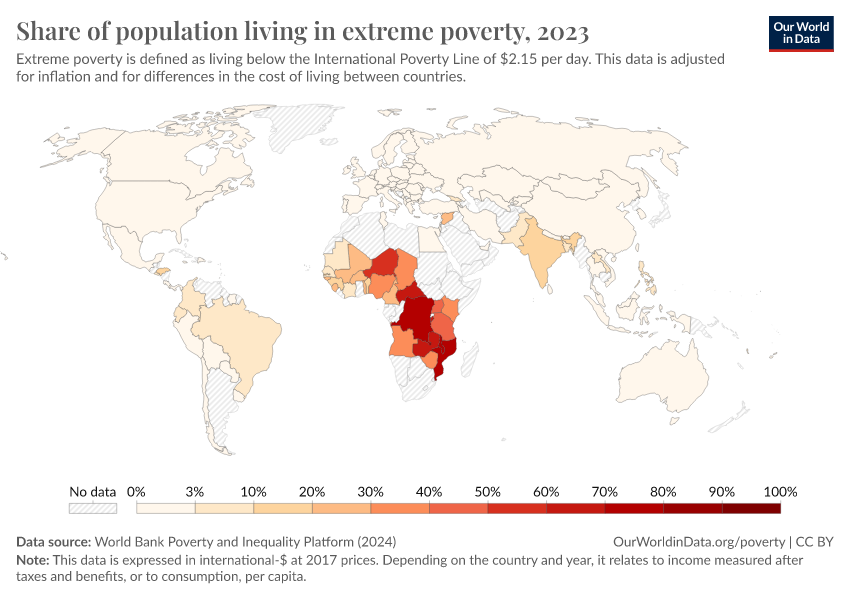
Share of population living in extreme povertyWorld Bank

Life expectancy at birthLong-run estimates collated from multiple sources by Our World in Data

Per capita CO₂ emissionsLong-run estimates from the Global Carbon Budget

GDP per capitaLong-run estimates from the Maddison Project Database

Share of people that are undernourishedFAO

Literacy rateLong-run estimates collated from multiple sources by Our World in Data

Share of the population with access to electricityWorld Bank

Data explorers

See all our Data Explorers

Interactive visualization tools to explore a wide range of related indicators.

Subscribe to our newsletters

Receive our latest work by email.
By subscribing you are agreeing to the terms of our privacy policy.

All our topics

All our data, research, and writing — topic by topic.

Population and Demographic Change

Health

Energy and Environment

Food and Agriculture

Poverty and Economic Development

Education and Knowledge

Innovation and Technological Change

Living Conditions, Community, and Wellbeing

Human Rights and Democracy

Violence and War