What does a famine declaration declare?
There are specific criteria for determining if a food crisis should be considered a famine, yet how famines are discussed can still be unclear.
In recent years, the international humanitarian community has agreed upon specific criteria for determining if a food crisis should be considered a famine. But given the range and complexity of food emergencies, the way in which famines, or potential famines, are discussed can still be quite unclear.
Here I look at two potentially confusing recent examples and, by considering in more detail how famines are classified, I try to clarify what's going on.
Famine in South Sudan in 2017
In February 2017, parts of South Sudan were officially declared by the UN as being in famine – the first such declaration since 2011. By May, the famine had apparently receded, thanks to an effective aid response that averted large-scale loss of life. And yet, the crisis was far from over. Indeed, the overall food security situation in the country had, in fact, “further deteriorated” over the same period, according to official reports1 – even as the “famine” status was being withdrawn.
“Largest humanitarian crisis” since 1945
Then, in March 2017, UN Emergency Relief Coordinator Stephen O'Brian, stated that the combined emergencies in South Sudan, Yemen, Somalia, and Nigeria represented the “largest humanitarian crisis since the creation of the UN”, with some 20 million people being “at risk of starvation”.2
The chart here shows the estimated number of people dying in individual famines since 1860 and provides some context for this statement based on our dataset of famines. The color of the line shows the continent in which the famine occurred. We can see that, were a mortality of the order of 20 million deaths to materialize, it would, as a combined figure, indeed rank as one of the most catastrophic famines in history, second only to the “Great Leap Forward famine” in China in 1959-61.
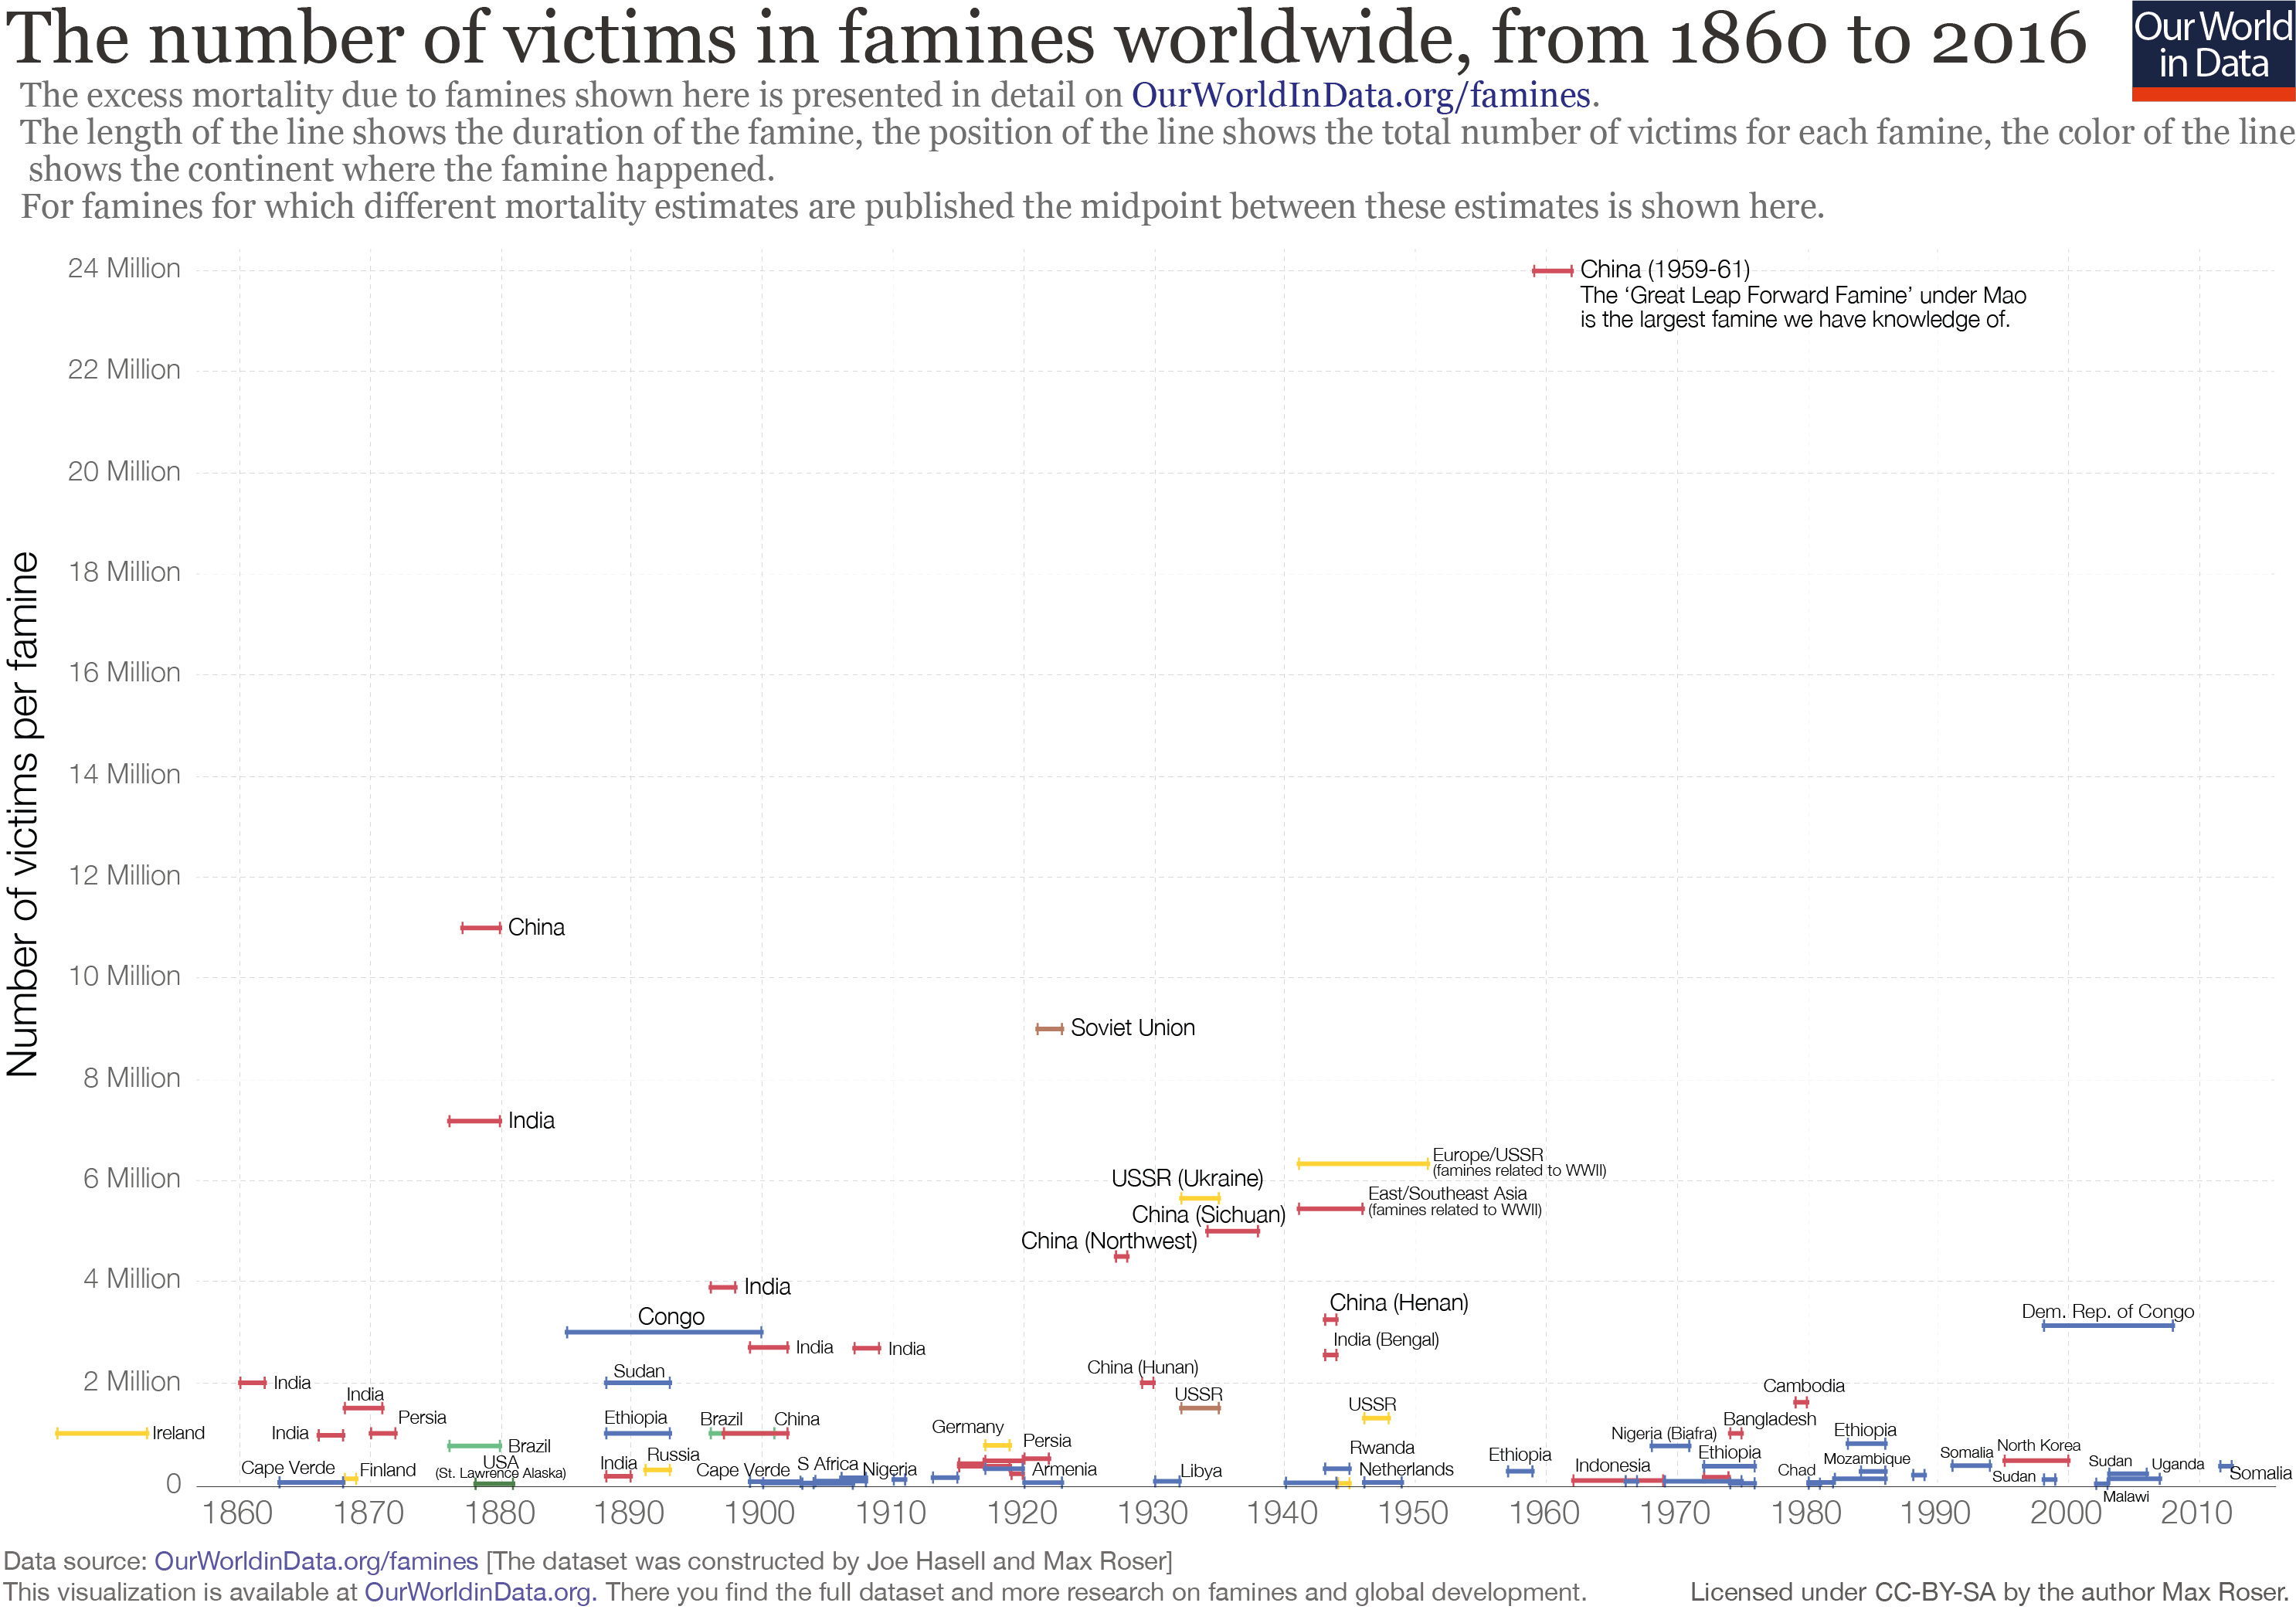
But we also see that, since the second half of the twentieth century, catastrophic famines – with mortalities in the millions – have been much less frequent compared to earlier periods.3
Many contributing factors explain the reduced number of famine casualties (as we discuss here), but most represent long-term trends, such as improvements in public health, access to markets, and transport infrastructure. Taken together, they have reduced the structural vulnerability of populations to the kinds of mortality rates witnessed in earlier famines. As such, famine scholar Alex de Waal writes, "Even if all four countries [– South Sudan, Yemen, Somalia and Nigeria –] do become famine-stricken, it is still very unlikely that levels of mortality will approach those in the calamitous famines of the mid-twentieth century."4
The humanitarian crisis is, nonetheless, very real. But how should we understand the gravity of the present situation in the context of the past?
A closer look
In order to approach this question and better understand the crisis in South Sudan, it is helpful to look more closely at how different degrees of food insecurity, including famine, are categorized today.
Intensity vs. magnitude
In declaring famines, the UN follows the Integrated Food Security Phase Classification (IPC) – you can find more details in the IPC famine factsheet and the more general IPC Manual.
The IPC lays out thresholds across three dimensions of outcomes, all of which must be evidenced in order for a famine to be declared in a certain area:
- Food consumption and livelihood change: At least one in five households faces an extreme lack of food, as evidenced by insufficient food consumption (in terms of quantity and/or quality) and by the coping strategies employed by or available to households (e.g., the extent to which assets like livestock or seed may have been sold off)
- Nutritional status: More than 30% of the population is suffering from “wasting” (being below 2 standard deviations below the median weight for a given height in the reference population)
- Mortality (due to inadequate food consumption):5At least two people out of every 10,000 and at least four children under five out of every 10,000 are dying per day.6
A few things about this definition are worth noting. Firstly, these thresholds represent only the most severe rank of the IPC food insecurity classification. The system ranges from Phase 1 to Phase 5, with 5 corresponding to a famine situation. Lower phases of food insecurity are categorized by lower thresholds in each of the three dimensions above.
Secondly, it is important to see that such thresholds are a measure of intensity rather than magnitude.7 That is to say, rather than trying to capture the absolute number of people in a certain situation of food insecurity, it looks at proportions within given geographic areas. Thus different assessments of food security trends will often be made depending on the geographic level of analysis. An amelioration at a very local level is perfectly compatible with an overall deterioration of the food security status of a country as a whole. And this is exactly what happened in South Sudan over the course of 2017.
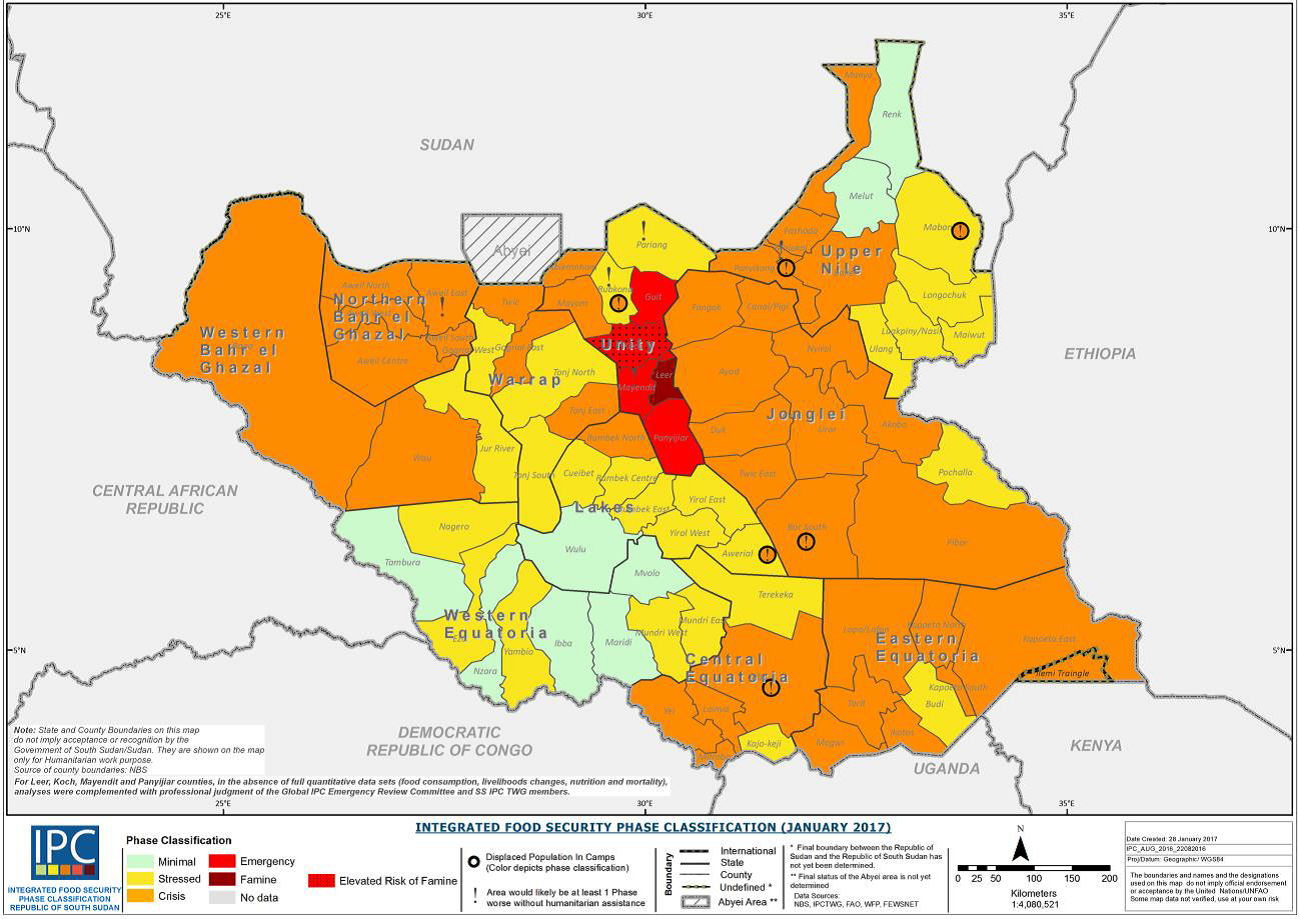
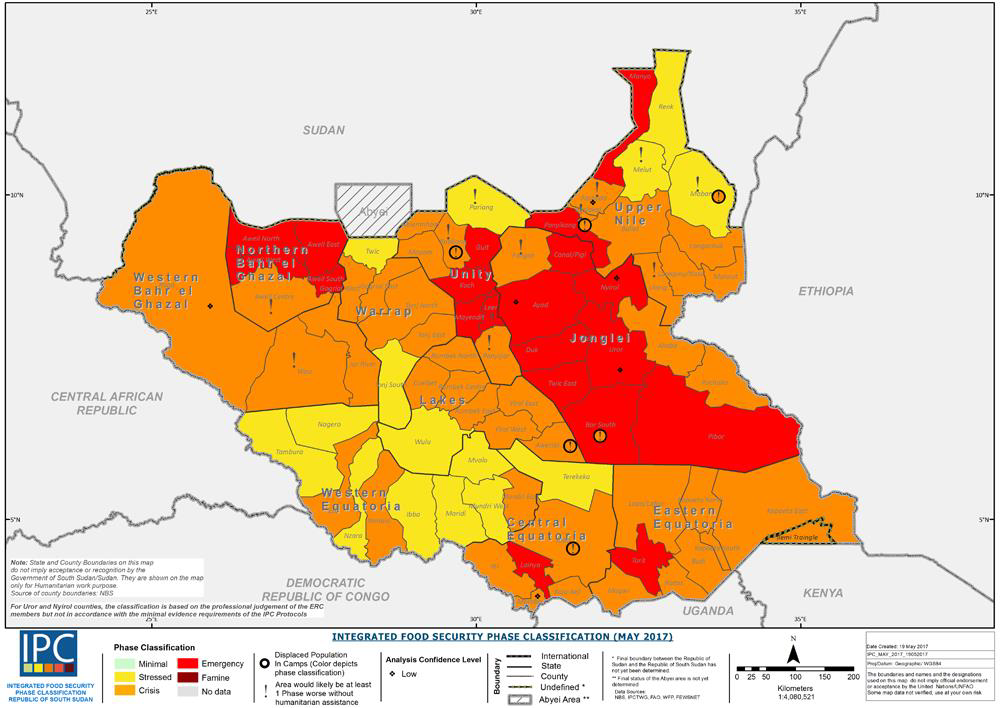
Here, we show two maps of South Sudan showing the IPC classification of each county in January and May 2017. The intensity of the food security situation in Unity State in January (shown in dark red colors) brought about the famine declaration later in February, with IPC Phase 5 thresholds being confirmed in some parts.
By May, the situation in Unity State had somewhat abated due to humanitarian relief efforts, but the food security situation of most other parts of the country had deteriorated significantly. Thus, while the 'famine' was over – in the very particular sense of there being no area where intensity thresholds met Phase 5 criteria – the food emergency had in fact become worse for most people.
Areas as a whole vs. individual households within an area
Just as different parts of a country can have different food security statuses, different households can, and typically do, experience different levels of food insecurity within any given geographic area. Rather than looking at geographical subdivisions, one way of getting a sense of how different people are faring in a food emergency is to look at the numbers of individual households experiencing different levels of food insecurity.
The IPC sets out such a 'Household Group Classification' alongside the 'Area Classification' outlined above. It mirrors the area classification in providing a Phase classification from 1 to 5, with 5 consisting of a 'Catastrophe' situation for the household. Since nutritional status and mortality data are typically collected for whole populations in a given area, only the food consumption and livelihood change dimension is used to categorize food security at the household level – though signs of malnutrition or excess mortality within the household are used to confirm the presence of extreme food gaps at the higher insecurity rankings.10
So, while the household-level classification considers fewer outcomes (only food deficits, as opposed to nutritional or mortality outcomes), it does allow for an assessment of the magnitude of a food emergency in terms of the absolute number of people being affected at different levels of severity. Looking at the household data for South Sudan over 2017 offers another angle on the evolution of the crisis. The two tables shown give the number of people estimated to be at a given level of insecurity across the different States in January (first table) and May (second table).
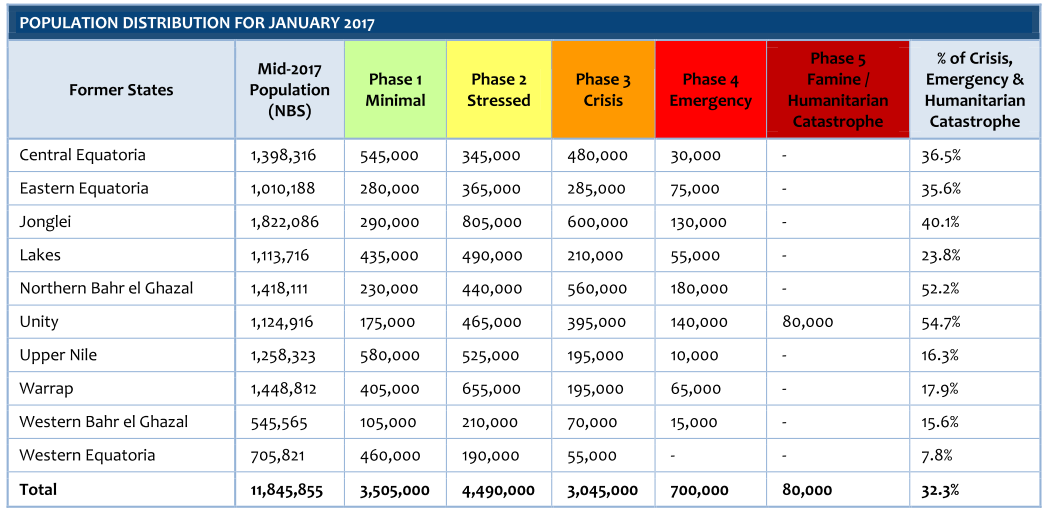
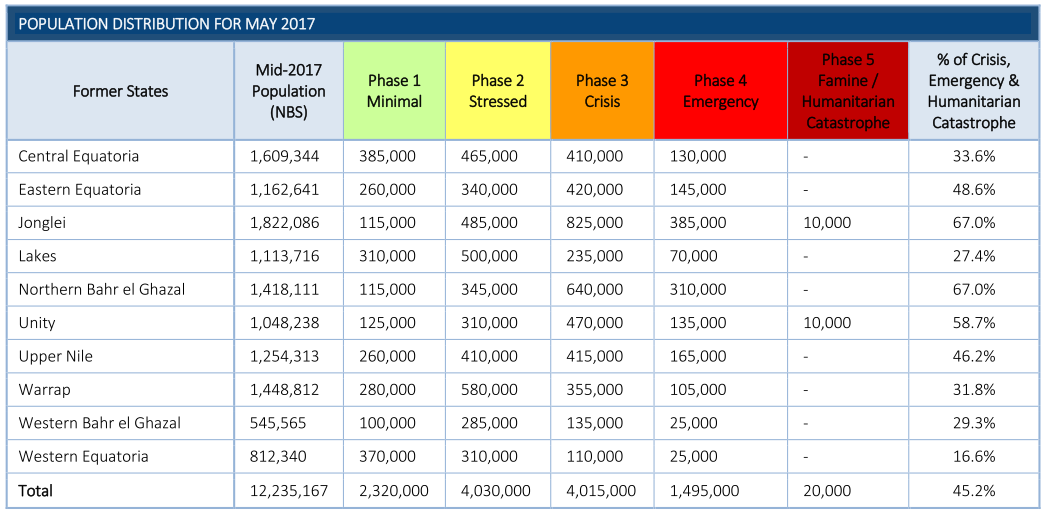
With such a disaggregation, we can see that the humanitarian provision targeted to the most in need in Unity State did indeed bring down the number of people experiencing the very worst food insecurity. It was on this basis that that country was no longer officially “in famine”. However, if we look at the number of individuals in Phase 3 (Crisis) or worse food insecurity, we see not only a deterioration in the country as a whole (45.2 % of the population in May compared to 32.3% in January), but even in Unity State itself (with 58.7% and 54.7% respectively).
Thus, while a binary 'famine/no-famine' categorization is very useful in terms of being able to draw international attention and relief efforts to the most dire situations, there are other dimensions that we should be aware of in trying to get a sense of the gravity of a food crisis, particularly in terms of its magnitude.
The global need for emergency food assistance
The Household Group IPC classification can be used to get a sense of the scale of the food emergencies currently underway. The Famine Early Warning Systems Network (FEWS), for instance, publishes estimates for the number of people in need of emergency food assistance, defined as those experiencing or imminently likely to experience Phase 3 (“Crisis”) food insecurity or worse. This corresponds to households experiencing "food consumption gaps with high or above usual acute malnutrition" or those "marginally able to meet minimum food needs only with accelerated depletion of livelihood assets that will lead to food consumption gaps."
And along this dimension, the numbers are, according to FEWS, “unprecedented in recent decades”.11
The numbers estimated to be in need of emergency assistance in 2017, as defined by FEWS, did represent a peak in recent times12 – and humanitarian needs remained high in 2018.
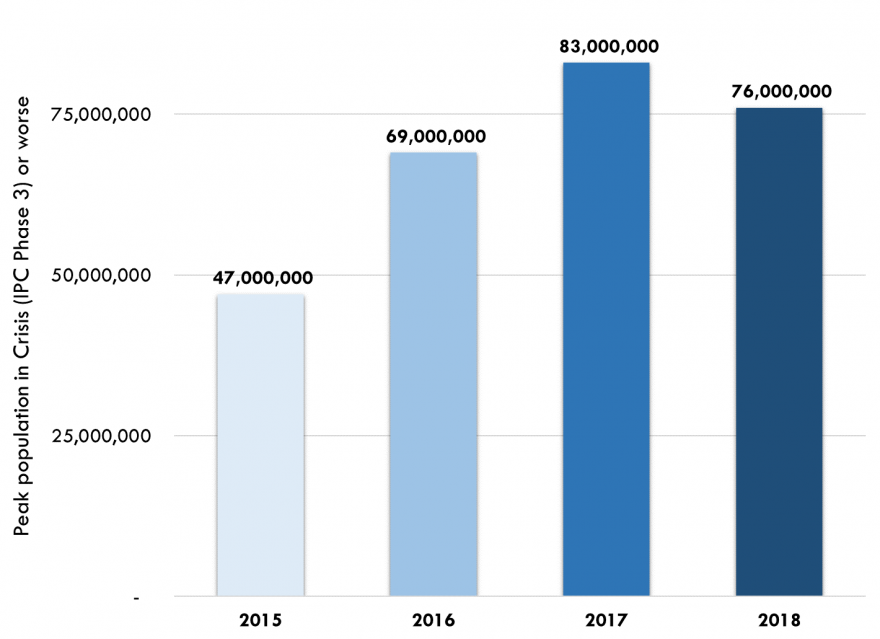
These high estimated levels of emergency assistance need led UN Emergency Relief Coordinator Stephen O'Brien to announce in 2017 that the world was facing the “largest humanitarian crisis since the creation of the UN”. This, however, does not imply an expectation that famine mortality would rise to the levels seen in the mid-20th Century. The broad developments that have reduced populations' vulnerability to such severe famine mortality, discussed here, make this unlikely.
Prospective vs. retrospective classification
The IPC system is fundamentally geared towards preventing famines rather than assessing their severity after the event. As stated in the IPC Manual,14
"The purpose of the IPC... is not to classify various degrees of famine, nor is it to categorize the “worst famine”. Rather, in order to inform real-time decision-making, the IPC thresholds for famine... are set to signify the beginning of famine stages."
It is important to bear this in mind when trying to compare such assessments with famine trends over time. Our table of famine mortality since 1860 provides estimates of the “excess mortality” associated with individual famines.15
In reference to the discussion above, this can be thought of as a measure of magnitude only along one dimension: mortality.
Official famine declarations based on the IPC Area classification, like that made for South Sudan in 2017, do not straightforwardly map onto such an analysis. For instance, given the larger population being affected, it is quite possible that more people have died due to food consumption deficits since early 2017 in Yemen than in South Sudan, despite the intensity of the former crisis not having brought about a famine declaration in any part of the country so far.16
In terms of classification based on excess mortality alone, there are no officially agreed criteria about which food emergencies should be counted as famines and which not. In collating our dataset of famines, we excluded events with an estimated mortality of less than one thousand.17 Currently our data do not include any mortality estimates for the crises in South Sudan, Yemen and elsewhere, but it now seems likely that in some cases, as mortality estimates emerge, their inclusion may be warranted.
Whether or not this will represent a reversal of the historical trend of decreasing famine mortality is as yet unknown and will largely depend upon how the conflicts driving the most acute food insecurity situations today will develop.
Endnotes
Integrated Food Security Phase Classification’s May 2017 communication. Access 22 Jan 2018
The statement was made at the 7897th UN Security Council briefing. Article accessed 21 Jan 2018.
The “catastrophic” category comes from Howe, P., Devereux, S. 2004. Famine intensity and magnitude scales: A proposal for an instrumental definition of famine. Disasters 28(4), 353–372.
It should be noted that the mortality estimate for the famine in the Democratic Republic of Congo around the turn of the millennium is somewhat controversial, with estimates ranging from under one million to over five million deaths. See the Data Quality section of the full entry on famines for more detail.
de Waal, A., The end of famine? Prospects for the elimination of mass starvation by political action, Political Geography (2017)
The IPC Manual ver. 2.0 states that "for both nutrition and mortality area outcomes, household food consumption deficits must be an explanatory factor in order for that evidence to be used in support of a Phase classification". Where, for instance, illness or conflict, unrelated to food consumption deficits, was the cause of mortality, this should not be included in the Phase assessment. However, it is common for poor health or conflict to exacerbate the extent or impact of food consumption deficits. Mortality generated in such circumstances is counted.
The key criterion is for the overall death rate to be above the 2/10,000 threshold. Where this is below the threshold level but the under-five death rate is above its threshold, famine should only be declared following consultation with an “Emergency Review Committee”. See IPC famine factsheet, and the more general IPC Manual ver. 2.0, accessed 26 Jan 2018.
This distinction in famine classification was made in an influential paper by Paul Howe and Steven Devereux in 2004, see Howe, P. & Devereux, S. 2004. Famine intensity and magnitude scales: A proposal for an instrumental definition of famine. Disasters 28(4), 353–372.
IPC Full Analysis Report, Jan 2017. Accessed 31 Jan 2018.
South Sudan: Current (May 2017) and Projected (June-July 2017) Acute Food Insecurity and Acute Malnutrition Situation. IPC. Accessed 31 Jan 2018.
The two classifications are linked by the fact that the categorization of households along this dimension forms the basis of the first threshold criterion of the area classification of food insecurity: "A key criterion for the Area classification is that 20 percent of the population must be in that Phase or worse based on the Household Group classification".
See FEWS article, accessed 27 Jan 2018. FEWS, in fact, later went on to increase its estimates for 2017 to 83 million, as shown in the bar chart.
This is based on FEWS' statement just cited. I was not able to find figures prior to 2015. It is important to note that the coverage of the FEWS analysis is not global, and the geographical coverage can change from year to year. The system looks at only those countries considered to be at risk of facing food crises. As such, it may not capture some households experiencing similar levels of food insecurity in countries that are not within this scope.
See article here, accessed 27 Jan 2018
IPC Manual version 2.0; the updated version 3.0 of the IPC Manual is now available.
That is to say, the number of deaths in addition to that which would have been expected in the famine's absence. It should be borne in mind that many of the estimates in our table, particularly those from earlier periods, are not based on detailed demographic data but rather represent a certain degree of guesswork on the part of either contemporary observers or historians. For more discussion, see the Data Quality section of our entry.
We are not aware of any mortality estimates for the crisis in South Sudan or Yemen currently. However, late in 2017, Save the Children predicted that child mortalities would go on to reach 50,000 by the end of that year. Accessed 31 Jan 2018.
Note that we have made use of a number of different sources and have thereby implicitly accepted the underlying definitions of famine held by observers and historians over time. It is likely that some events that today would be considered famines may not have been seen as such in the past and will therefore be missing from our table.
Cite this work
Our articles and data visualizations rely on work from many different people and organizations. When citing this article, please also cite the underlying data sources. This article can be cited as:
Joe Hasell (2018) - “What does a famine declaration declare?” Published online at OurWorldInData.org. Retrieved from: 'https://ourworldindata.org/what-does-a-famine-declaration-declare' [Online Resource]BibTeX citation
@article{owid-what-does-a-famine-declaration-declare,
    author = {Joe Hasell},
    title = {What does a famine declaration declare?},
    journal = {Our World in Data},
    year = {2018},
    note = {https://ourworldindata.org/what-does-a-famine-declaration-declare}
}
Reuse this work freely
All visualizations, data, and code produced by Our World in Data are completely open access under the Creative Commons BY license. You have the permission to use, distribute, and reproduce these in any medium, provided the source and authors are credited.
The data produced by third parties and made available by Our World in Data is subject to the license terms from the original third-party authors. We will always indicate the original source of the data in our documentation, so you should always check the license of any such third-party data before use and redistribution.
All of our charts can be embedded in any site.

