Our work belongs to everyone
- All our code is open-source
- All our research and visualizations are free for everyone to use for all purposes
This page has a large number of charts on the pandemic. In the box below you can select any country you are interested in – or several, if you want to compare countries.
All charts on this page will then show data for the countries that you selected.
What is the daily number of confirmed cases?

This chart shows the number of confirmed COVID-19 cases per day.
What is important to note about these case figures?
- The reported case figures on a given date do not necessarily show the number of new cases on that day – this is due to delays in reporting.
- The actual number of cases is likely to be much higher than the number of confirmed cases – this is due to limited testing. In a separate post we discuss how models of COVID-19 help us estimate the actual number of cases.
→ We provide more detail on these points in the section ‘Cases of COVID-19: background‘.
Five quick reminders on how to interact with this chart
- By clicking on Edit countries and regions you can show and compare the data for any country in the world you are interested in.
- If you click on the title of the chart, the chart will open in a new tab. You can then copy-paste the URL and share it.
- You can switch the chart to a logarithmic axis by clicking on ‘LOG’.
- If you move both ends of the time-slider to a single point you will see a bar chart for that point in time.
- Map view: switch to a global map of confirmed cases using the ‘MAP’ tab at the bottom of the chart.
Daily confirmed cases per million people
Differences in the population size between different countries are often large – it is insightful to compare the number of confirmed cases per million people.
Keep in mind that in countries that do very little testing the actual number of cases can be much higher than the number of confirmed cases shown here.
Three tips on how to interact with this map
- By clicking on any country on the map you see the change over time in this country.
- By moving the time slider (below the map) you can see how the global situation has changed over time.
- You can focus on a particular world region using the dropdown menu to the top-right of the map.
What is the cumulative number of confirmed cases?
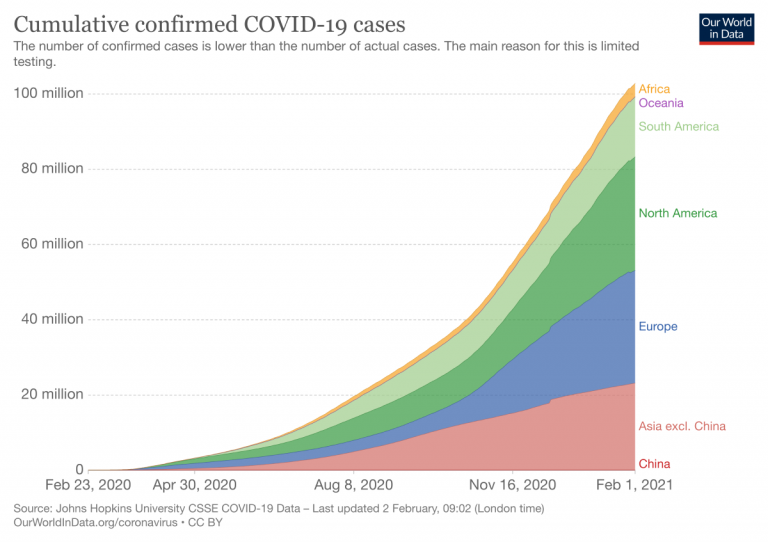

The previous charts looked at the number of confirmed cases per day – this chart shows the cumulative number of confirmed cases since the beginning of the COVID-19 pandemic.
Cumulative confirmed cases per million people
This chart shows the cumulative number of confirmed cases per million people.
Weekly and biweekly cases: where are confirmed cases increasing or falling?
Why is it useful to look at weekly or biweekly changes in confirmed cases?
For all global data sources on the pandemic, daily data does not necessarily refer to the number of new confirmed cases on that day – but to the cases reported on that day.
Since reporting can vary significantly from day to day – irrespectively of any actual variation of cases – it is helpful to look at changes from week to week. This provides a slightly clearer picture of where the pandemic is accelerating, slowing, or in fact reducing.
The maps shown here provide figures on weekly and biweekly confirmed cases: one set shows the number of confirmed cases per million people in the previous seven (or fourteen) days (the weekly or biweekly cumulative total); the other set shows the percentage change (growth rate) over these periods.


About this data
Our data on SARS-CoV-2 sequencing and variants is sourced from GISAID, a global science initiative that provides open-access to genomic data of SARS-CoV-2. We recognize the work of the authors and laboratories responsible for producing this data and sharing it via the GISAID initiative.
Khare, S., et al (2021) GISAID’s Role in Pandemic Response. China CDC Weekly, 3(49): 1049-1051. doi: 10.46234/ccdcw2021.255 PMCID: 8668406
Elbe, S. and Buckland-Merrett, G. (2017) Data, disease and diplomacy: GISAID’s innovative contribution to global health. Global Challenges, 1:33-46. doi:10.1002/gch2.1018 PMCID: 31565258
Shu, Y. and McCauley, J. (2017) GISAID: from vision to reality. EuroSurveillance, 22(13) doi:10.2807/1560-7917.ES.2017.22.13.30494 PMCID: PMC5388101
We download aggregate-level data via CoVariants.org.
All countries report data on the results from sequenced samples every 14 days, although some of them may share partial data in advance. We obtain the share of each variant by dividing the number of sequences labelled for that variant by the total number of sequences. Since only a fraction of all cases are sequenced, this share may not reflect the complete breakdown of cases. In addition, recently-discovered or actively-monitored variants may be overrepresented, as suspected cases of these variants are likely to be sequenced preferentially or faster than other cases.


In this document, the many linked charts, our COVID-19 Data Explorer, and the Complete COVID-19 dataset, we report and visualize the data on confirmed cases and deaths from the World Health Organization (WHO). We make the data in our charts and tables downloadable as complete and structured CSV, XLSX, and JSON files on GitHub.
The WHO has published updates on confirmed cases and deaths on its dashboard for all countries since 31 December 2019. From 31 December 2019 to 21 March 2020, this data was sourced through official communications under the International Health Regulations (IHR, 2005), complemented by publications on official ministries of health websites and social media accounts. Since 22 March 2020, the data has been compiled through WHO region-specific dashboards or direct reporting to WHO.
The WHO updates its data once per week.
In epidemiology, individuals who meet the case definition of a disease are often categorized on three different levels.
These definitions are often specific to the particular disease, but generally have some clear and overlapping criteria.
Cases of COVID-19 – as with other diseases – are broadly defined under a three-level system: suspected, probable and confirmed cases.
- Suspected case
A suspected case is someone who shows clinical signs and symptoms of having COVID-19, but has not been laboratory-tested. - Probable case
A suspected case with an epidemiological link to a confirmed case. This means someone who is showing symptoms of COVID-19 and has either been in close contact with a positive case, or is in a particularly COVID-affected area.1 - Confirmed case
A confirmed case is “a person with laboratory confirmation of COVID-19 infection” as the World Health Organization (WHO) explains.2
Typically, for a case to be confirmed, a person must have a positive result from laboratory tests. This is true regardless of whether they have shown symptoms of COVID-19 or not.
This means that the number of confirmed cases is lower than the number of probable cases, which is in turn lower than the number of suspected cases. The gap between these figures is partially explained by limited testing for the disease.
We have three levels of case definition: suspected, probable and confirmed cases. What is measured and reported by governments and international organizations?
International organizations – namely the WHO and European CDC – report case figures submitted by national governments. Wherever possible they aim to report confirmed cases, for two key reasons:
1. They have a higher degree of certainty because they have laboratory confirmation;
2. They help to provide standardised comparisons between countries.
However, international bodies can only provide figures as submitted by national governments and reporting institutions. Countries can define slightly different criteria for how cases are defined and reported.3 Some countries have, over the course of the outbreak, changed their reporting methodologies to also include probable cases.
One example of this is the United States. Until 14th April 2020 the US CDC provided daily reports on the number of confirmed cases. However, as of 14th April, it now provides a single figure of cases: the sum of confirmed and probable cases.
Suspected case figures are usually not reported. The European CDC notes that suspected cases should not be reported at the European level (although countries may record this information for national records) but are used to understand who should be tested for the disease.
The number of confirmed cases reported by any institution – including the WHO, the ECDC, Johns Hopkins and others – on a given day does not represent the actual number of new cases on that date. This is because of the long reporting chain that exists between a new case and its inclusion in national or international statistics.
The steps in this chain are different across countries, but for many countries the reporting chain includes most of the following steps:
- Doctor or laboratory diagnoses a COVID-19 case based on testing or combination of symptoms and epidemiological probability (such as a close family member testing positive).
- Doctor or laboratory submits a report to the health department of the city or local district.
- Health department receives the report and records each individual case in the reporting system, including patient information.
- The ministry or another governmental organization brings this data together and publishes the latest figures.
- International data bodies such as the WHO or the ECDC can then collate statistics from hundreds of such national accounts.
This reporting chain can take several days. This is why the figures reported on any given date do not necessarily reflect the number of new cases on that specific date.
To understand the scale of the COVID-19 outbreak, and respond appropriately, we would want to know how many people are infected by COVID-19. We would want to know the actual number of cases.
However, the actual number of COVID-19 cases is not known. When media outlets claim to report the ‘number of cases’ they are not being precise and omit to say that it is the number of confirmed cases they speak about.
The actual number of cases is not known, not by us at Our World in Data, nor by any other research, governmental or reporting institution.
The number of confirmed cases is lower than the number of actual cases because not everyone is tested. Not all cases have a “laboratory confirmation”; testing is what makes the difference between the number of confirmed and actual cases.
All countries have been struggling to test a large number of cases, which means that not every person that should have been tested has been tested.
Since an understanding of testing for COVID-19 is crucial for an interpretation of the reported numbers of confirmed cases we have looked into the testing for COVID-19 in more detail.
You find our work on testing here. In a separate post we discuss how models of COVID-19 help us estimate the actual number of cases.
We would like to acknowledge and thank a number of people in the development of this work: Carl Bergstrom, Bernadeta Dadonaite, Natalie Dean, Joel Hellewell, Jason Hendry, Adam Kucharski, Moritz Kraemer and Eric Topol for their very helpful and detailed comments and suggestions on earlier versions of this work. We thank Tom Chivers for his editorial review and feedback.
And we would like to thank the many hundreds of readers who give us feedback on this work. Your feedback is what allows us to continuously clarify and improve it. We very much appreciate you taking the time to write. We cannot respond to every message we receive, but we do read all feedback and aim to take the many helpful ideas into account.