Global inequalities in CO₂ emissions from aviation
Aviation accounts for 2.5% of global CO₂ emissions. Where do these emissions come from?
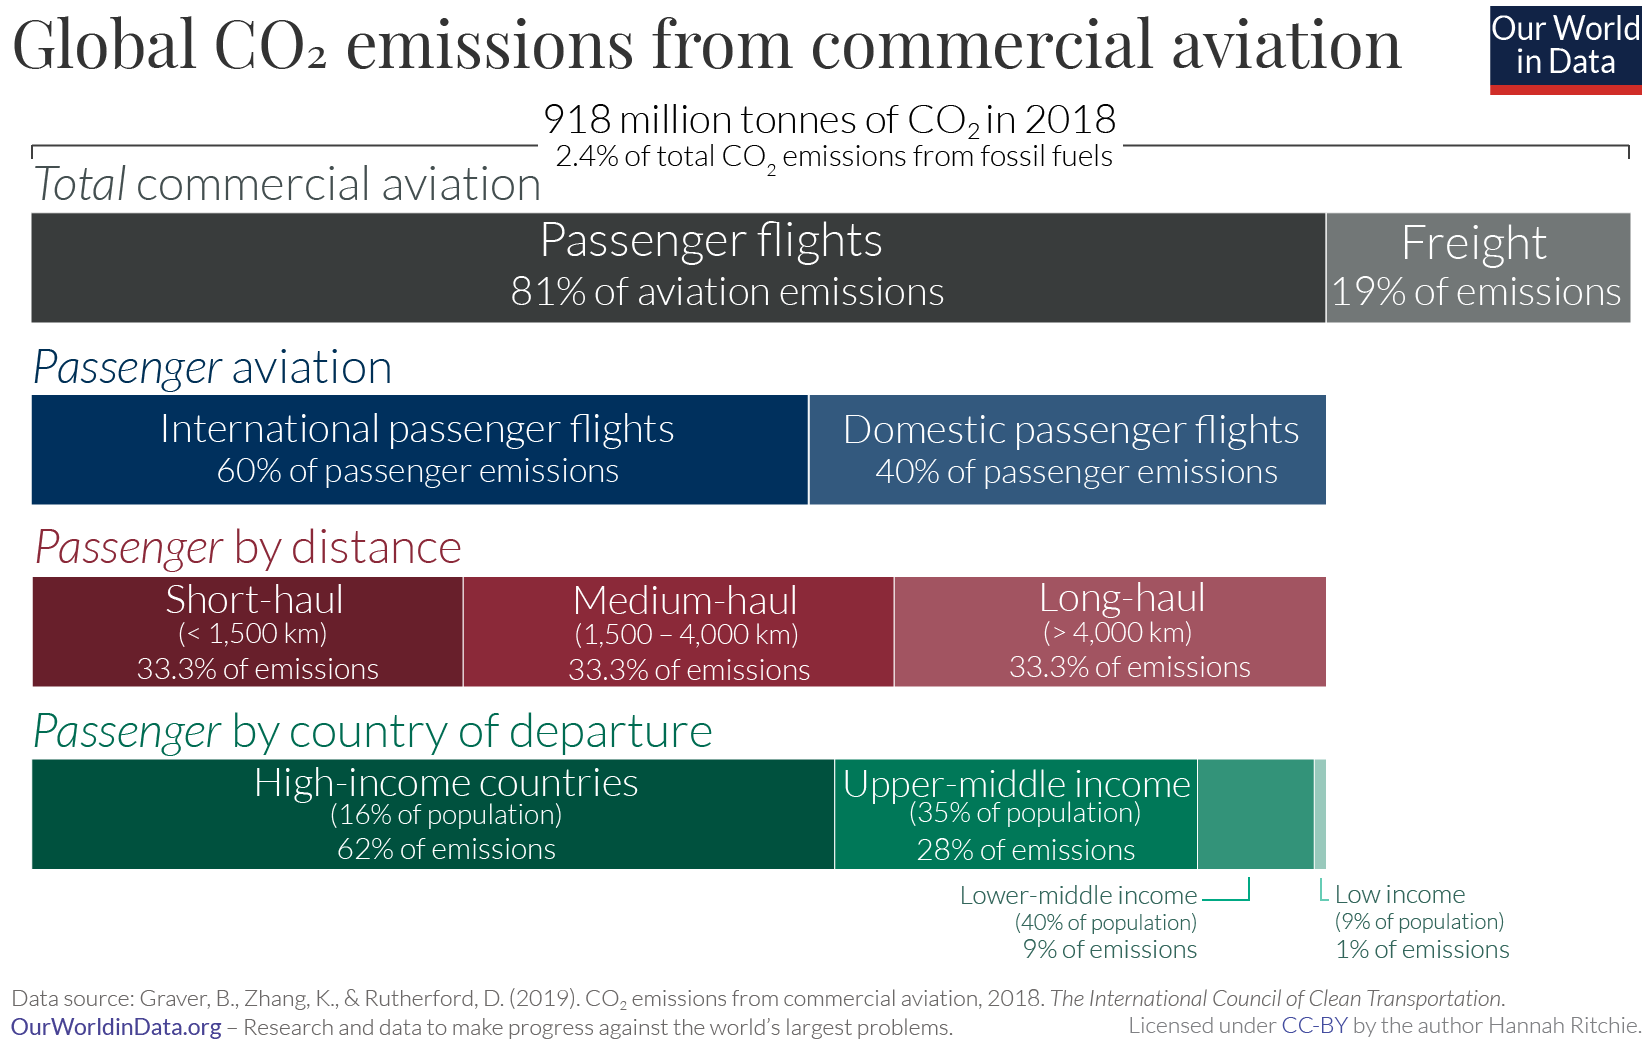
Global aviation – both passenger flights and freight – emits around one billion tonnes of carbon dioxide (CO2) each year. This was equivalent to around 2.4% of CO2 emissions in 2018.
How do global aviation emissions break down?
The chart gives the answer. This data is sourced from the 2019 International Council on Clean Transportation(ICCT) report on global aviation.1
Most emissions come from passenger flights – in 2018, they accounted for 81% of aviation’s emissions; the remaining 19% came from freight, the transport of goods.
Sixty percent of emissions from passenger flights come from international travel; the other 40% come from domestic (in-country) flights.
When we break passenger flight emissions down by travel distance, we get a (surprisingly) equal three-way split in emissions between short-haul (less than 1,500 kilometers); medium-haul (1,500 to 4,000 km); and long-haul (greater than 4,000 km) journeys.

The richest half are responsible for 90% of air travel CO2 emissions
The global inequalities in how much people fly become clear when we compare aviation emissions across countries of different income levels. The ICCT split these emissions based on World Bank's four income groups.
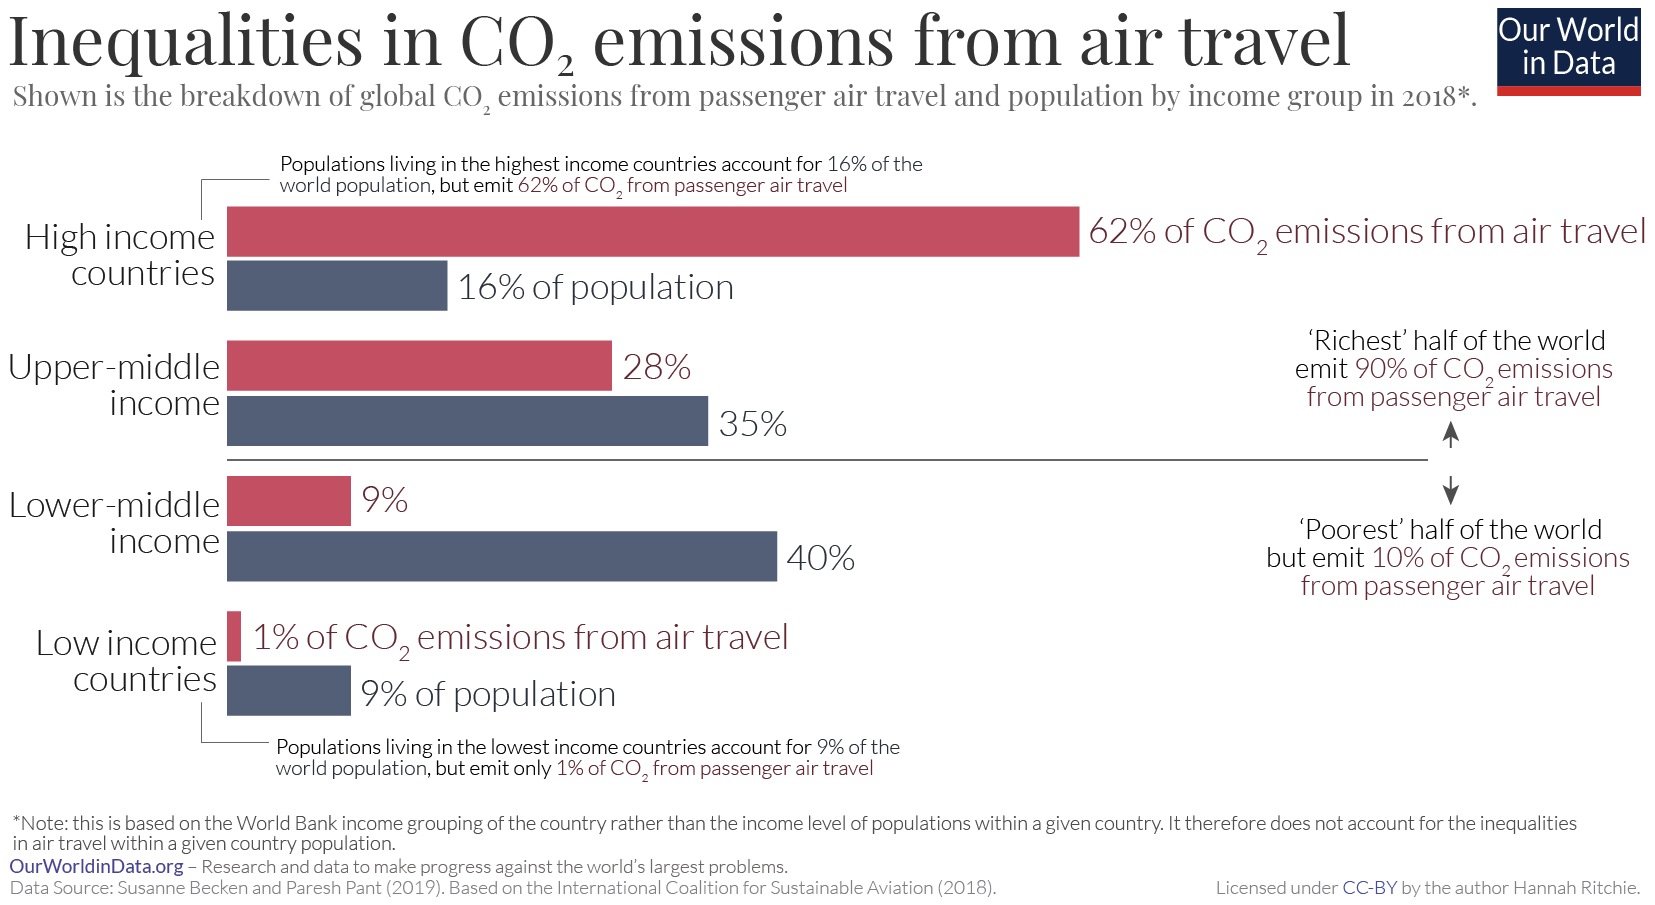
A further study by Susanne Becek and Paresh Pant (2019) compared the contribution of each income group to global air travel emissions versus its share of world population.2 This comparison is shown in the visualization.
The ‘richest’ half of the world (high and upper-middle-income countries) were responsible for 90% of air travel emissions.3
Looking at specific income groups:
- Only 16% of the world population live in high-income countries yet the planes that take off in those countries account for almost two-thirds (62%) of passenger emissions;
- Upper-middle income countries are home to 35% of the world population, and contribute 28% of emissions;
- Lower-middle income countries are home to the largest share (40% of the world), yet the planes taking off there just account for 9%;
- The poorest countries – which are home to 9% of the world's population – emit just 1%.

Endnotes
Graver, B., Zhang, K., & Rutherford, D. (2019). CO2 emissions from commercial aviation, 2018. The International Council of Clean Transportation.
Becken, S. and P. Pant (2019). Airline initiatives to reduce climate impact: ways to accelerate action (White paper).
Note that this is based on categorizations from the average income level of countries, and does not take into account variation in income within countries. If we were to look at this distribution based on the income level of individuals rather than countries, the inequality in aviation emissions would be even larger.
Cite this work
Our articles and data visualizations rely on work from many different people and organizations. When citing this article, please also cite the underlying data sources. This article can be cited as:
Hannah Ritchie (2020) - “Global inequalities in CO₂ emissions from aviation” Published online at OurWorldinData.org. Retrieved from: 'https://ourworldindata.org/breakdown-co2-aviation' [Online Resource]BibTeX citation
@article{owid-breakdown-co2-aviation,
    author = {Hannah Ritchie},
    title = {Global inequalities in CO₂ emissions from aviation},
    journal = {Our World in Data},
    year = {2020},
    note = {https://ourworldindata.org/breakdown-co2-aviation}
}
Reuse this work freely
All visualizations, data, and code produced by Our World in Data are completely open access under the Creative Commons BY license. You have the permission to use, distribute, and reproduce these in any medium, provided the source and authors are credited.
The data produced by third parties and made available by Our World in Data is subject to the license terms from the original third-party authors. We will always indicate the original source of the data in our documentation, so you should always check the license of any such third-party data before use and redistribution.
All of our charts can be embedded in any site.

