Gdoc/Admin

Popular pages

Research and data to make progress against the world’s largest problems.

14,384 charts across 123 topicsAll free: open access and open source

Our Mission

What do we need to know to make the world a better place?

To make progress against the pressing problems the world faces, we need to be informed by the best research and data.

Our World in Data makes this knowledge accessible and understandable, to empower those working to build a better world.

Read about our mission

We are a non-profit — all our work is free to use and open source. Consider supporting us if you find our work valuable.

Donate to support us
As seen on
Logos of the publications that have used our content. From left to right: Science, Nature, PNAS, BBC, Financial Times, The New York Times, The Guardian, The Atlantic, and The Washington Post

Data Insights

Bite-sized insights on how the world is changing, published every few days.

See all Data Insights
A chart illustrates the improvement of AI systems in performing longer software tasks over time. The horizontal axis spans from 2019 to mid 2025, marking the development of various AI models, such as GPT-2, GPT-3, GPT-3.5, and several iterations of GPT-4. The vertical axis indicates the length of time in minutes that tasks  take human professionals. Key points highlighted include:

- "GPT 3.5 (which came out in Spring 2022) could only do tasks that take humans a few seconds, such as selecting the right file"
- "OpenAI's o3(which came out in April 2025) can do tasks on its own that take humans 20 minutes," such as finding and fixing small bugs in code
- The observed trend shows a rapid progression in AI capability

Accompanying notes indicate that the data is based on 170 tasks across fields like software engineering and machine learning. The source for this data is the Model Evaluation & Threat Research (METR) from 2025, presented under a Creative Commons attribution license.

The length of software tasks AI systems can do on their own has been increasing quickly

How will artificial intelligence (AI) impact people’s jobs?

This question has no simple answer, but the more AI systems can independently carry out long, job-like tasks, the greater their impact will likely be.

The chart shows a trend in this direction for software-related tasks. The length of tasks — in terms of how long they take human professionals — that AIs can do on their own has increased quickly in the past couple of years.

Before 2023, even the best AI systems could only perform tasks that take people around 10 seconds, such as selecting the right file.

Today, the best AIs can fairly reliably (with an 80% success rate) do tasks that take people 20 minutes or more, such as finding and fixing bugs in code or configuring common software packages.

It’s unclear how much these results generalize; other factors, like reliability, need to be considered.

But AI capabilities continue to improve, and if developments keep pace for the next few years, we could see systems capable of performing tasks that take people days or even longer.

Read more about how we can help make our future with AI go well

Continue reading
A line graph illustrates the share of new cars sold that are electric in three regions: China, the European Union, and the United States from 2020 to 2023. The vertical axis indicates the percentage of electric cars, ranging from 0% to 40%, with marked points at 2%, 6%, 10%, and 22%. 

In 2020, China starts at 2%, showing a steady upward trend, culminating at 38% in 2023. The European Union begins similarly at 6%, increasing to 22% by 2023. The United States, starting at 2%, progresses to 10% over the same period, showing the slowest growth among the three.

The graph highlights China's significant lead over both the EU and the US in the adoption of electric cars. 

Data source is the International Energy Agency, specifically from the Global EV Outlook 2024 report. A note indicates that in China and the EU, two-thirds of these cars are fully electric, while in the US, 80% are.

China is moving much faster on electric cars than the EU or the United States

Road transport is responsible for around three-quarters of global carbon dioxide emissions from transport. Switching from petrol and diesel to electric vehicles is an important solution to decarbonize our economies.

This chart shows the change in share of new cars that were electric in China, the European Union (EU), and the United States (US) between 2020 and 2023. This includes fully electric and plug-in hybrid cars, though most are fully electric.

In 2020, electric cars were rare everywhere. But by 2023, over one-third of new vehicles in China were electric, compared to less than a quarter in the EU and under a tenth in the US.

While we only have annual data up to 2023, preliminary figures suggest that in 2024, electric cars outsold conventional ones for the first time in China.

Explore data on electric car sales for more countries

Continue reading
A world map that highlights countries where women face restrictions on their right to work compared to men. The areas shaded in dark red indicate where husbands can prevent their wives from working, or where women require additional permissions for employment. Included text notes specific examples: Afghanistan, where the Taliban imposes strict restrictions on women's right to work outside the home, and Yemen, where women may work but often need permission from a male guardian and could face legal repercussions if they do not comply. The map is surrounded by a header that reads, "Where are women not allowed to take the same jobs as men?" and provides context about the legal implications of these restrictions. Data sources listed at the bottom include the World Bank's report titled "Women, Business and the Law" for the year 2024, with a note stating that the data is from 2023. The copyright attribution is indicated as CC BY.

In some countries, women still don’t have the same freedom to work as men

Many previous generations of women in my family would not have been allowed to do the work I do today — even if computers, the Internet, and Our World in Data had existed then. Thankfully, that’s no longer the case where I live: I’ve had the same right to get an education, work, and build a career as my brother.

Unfortunately, that’s not the case everywhere.

The map highlights the countries where women had legal restrictions on their rights to work in formal employment in 2023. All are in the Middle East, North Africa, or Sub-Saharan Africa.

These restrictions can include the need for permission or documentation from a male family member — such as a husband or brother — to work, or legal consequences if they don’t follow working restrictions.

While nearly 20 countries still have these legal barriers for women, this number was much larger in the past: in 1970, it was almost 70.

This data only reflects legal restrictions on working rights. In other countries, strong social or cultural pressures still mean that women are less likely to be in formal employment than men, even if they’re legally allowed to.

Explore more data on female participation in the workforce

Continue reading
A line graph illustrates the daily hours spent with children by women and men in the U.S., across men and women's lifetimes.

The y-axis indicates hours per day spent with children, ranging from 0 to 6 hours. The x-axis represents the ages from 15 to 80. 

Notable points include:
- Women aged 35 spend more than 5 hours daily with children.
- Men aged 35 spend about 3 hours daily with children.

Overall, the graph demonstrates that women consistently spend more time with children than men across all ages.

Data source: U.S. Bureau of Labor Statistics (2023). Note: The analysis considers underage children related to the surveyed individual and those living in the same household (e.g. step-children) and includes all time spent with the child in the same room.

Women in the US spend more time with children than men do, across all ages

In the United States, women spend more time with children than men. This is true for adults of any age.

The difference is especially large for people in their 20s and 30s. For example, at age 35, women spend an average of five hours per day with children, while men spend around three hours. (Considered here are people’s children, step and foster children, grandchildren, and other family members under 18.)

Although the gap is smaller for older people, even in later life, women spend more time with children than men.

This gap reflects traditional gender roles, where women do more childcare and less paid work. But it also has broader implications: women spend less time with friends and alone than men, which may affect their social connections, leisure, and well-being.

This data comes from the American Time Use Survey by the US Bureau of Labor Statistics.

Learn more about how men and women spend their time throughout life

Continue reading
The visualization illustrates the increase in mobile cellular subscriptions per 100 people across various global regions from the year 2000 to 2023. Each region is represented by a line graph with specific data points.

- North America: Increased from 38 subscriptions in 2000 to 110 in 2023.
- Europe and Central Asia: Rose from 34 in 2000 to 128 in 2023.
- Latin America and Caribbean: Grew from 12 in 2000 to 112 in 2023.
- East Asia and Pacific: Expanded from 11 in 2000 to 130 in 2023.
- Sub-Saharan Africa: Increased from 2 in 2000 to 89 in 2023.
- South Asia: Went from less than 1 in 2000 to 84 in 2023.

The chart notes that the data source is the World Bank with a publication year of 2025, and it explains that the number can exceed 100 in instances where individuals may have multiple subscriptions.

Every global region has seen a steep rise in mobile phone subscriptions

Mobile phones have achieved what few technologies do: they’ve been adopted rapidly by people all over the world, in both rich and poor regions.

The chart shows how mobile subscriptions grew between 2000 and 2023. This is given per 100 people in each world region. If the number is over 100, it means some people own more than one mobile device. (This data doesn’t tell us the percentage of people with a phone, as some individuals own multiple devices.)

Mobile phone subscriptions have risen sharply everywhere in just a few decades. Even in the poorest parts of the world, like Sub-Saharan Africa, subscriptions grew from just 2 per 100 people to 89. In South Asia, they went from less than 1 to 84.

Still, this rise matters because mobile phones allow people to learn, connect, and build, even in places without physical infrastructure (like roads or banks). For example, mobile money systems enable people to save, send, and receive money without needing a bank branch or an Internet connection. This has helped millions improve their financial security.

Explore more data on mobile phone subscriptions

Continue reading
The image presents a scatter plot illustrating the relationship between the annual amount spent on food and the share of total consumer expenditure that is allocated to food across various countries. The x-axis represents the annual amount spent on food in US dollars, ranging from $0 to $4,000. The y-axis indicates the percentage of total expenditure spent on food, from 0% to 60%. 

Several key data points are highlighted: 

- Kenya, where the average food spending is $900, accounting for 58% of total expenditure.
- Kazakhstan appears on the plot, contributing to the overall trend of expenditure.
- The United States, where the average spending on food is $3,400, making up 10% of total spending.
- Switzerland, with an average food spending of $4,100, represents only 9% of total expenditure.
- Venezuela is also marked on the graph.

The title emphasizes that people in richer countries tend to spend more on food overall, yet this spending constitutes a smaller portion of their total spending. 

In the footer, the data source is referenced as the USDA Economic Research Service (ERS) from 2023, indicating that the food expenditure is not adjusted for differences in living costs between countries. The graphic is licensed under Creative Commons BY, allowing for redistribution with proper attribution.

People in richer countries spend more on food, but it’s a smaller share of their overall spending

Three billion people worldwide cannot afford a healthy diet that gives them all the nutrients they need.

Most of these people live in low- to middle-income countries, where people have less money to spend on food. You might rightly guess that people in richer countries tend to spend more on food — but they also spend a smaller share of overall spending on food. You can see this in the chart, where each dot represents one country in 2022.

The average budget in Switzerland for food consumed at home was more than four times that of Kenya (when measured in US dollars). But food made up less than 10% of Swiss consumer spending, compared to almost 60% in Kenya.

This means people in richer countries don’t only have more money to spend on food; they also have far more left to spend on other important resources, like housing, education, clothing, and health.

Read more in my article “Engel's Law: Richer people spend more money on food, but it makes up a smaller share of their income” →

Continue reading
This visual representation displays two vertical bar graphs side by side. The left graph indicates the share of the global population, showing that Sub-Saharan Africa is home to 16% of the world's total population, while the majority resides in a section labeled "Rest of the World." The right graph illustrates the share of people living in extreme poverty, defined as those living on less than $2.15 per day. Here, Sub-Saharan Africa accounts for 67% of the global population living in extreme poverty, contrasting sharply with the much smaller percentage attributed to the Rest of the World. 

Text on the left states, "16% of all people live in Sub-Saharan Africa," and an arrow points towards it. The text on the right concludes with, "...but 67% of all people in extreme poverty live there." The infographic is attributed to Our World in Data, with a footer noting the data is sourced from the World Bank for the year 2024. The image is licensed under CC BY.

One in six people live in Sub-Saharan Africa, but it accounts for two-thirds of global extreme poverty

Every twelfth person in the world still lives in extreme poverty. That means surviving on less than $2.15 per day (adjusted for differences in living costs between countries).

For many, that means struggling to afford nutritious food, not being able to afford basic healthcare, safe sanitation, or electricity.

So, where do most people in extreme poverty live? The chart shows that Sub-Saharan Africa, which is home to just 16% of the global population, now accounts for 67% of people living in extreme poverty.

This distribution is very different from 25 years ago. In 2000, Asia was home to most of the world’s population living in extreme poverty. However, strong economic growth in recent decades has led to steep reductions in poverty. Progress in Sub-Saharan Africa has been much slower.

If we're serious about ending extreme poverty worldwide, supporting economic development in Sub-Saharan Africa has to be a top priority. The recent progress achieved by some African countries reminds us that meaningful change is within reach.

Explore more data on extreme poverty

Continue reading

Get Data Insights delivered to your inbox

Receive an email from us when we publish a Data Insight (every few days).

By subscribing you are agreeing to the terms of our privacy policy.

Explore our data

Featured data from our collection of 14,384 interactive charts.

See all our data

What share of children die before their fifth birthday?

What could be more tragic than the death of a young child? Child mortality, the death of children under the age of five, is still extremely common in our world today.

The historical data makes clear that it doesn’t have to be this way: it is possible for societies to protect their children and reduce child mortality to very low rates. For child mortality to reach low levels, many things have to go right at the same time: good healthcare, good nutrition, clean water and sanitation, maternal health, and high living standards. We can, therefore, think of child mortality as a proxy indicator of a country’s living conditions.

The chart shows our long-run data on child mortality, which allows you to see how child mortality has changed in countries around the world.

Explore and learn more about this data

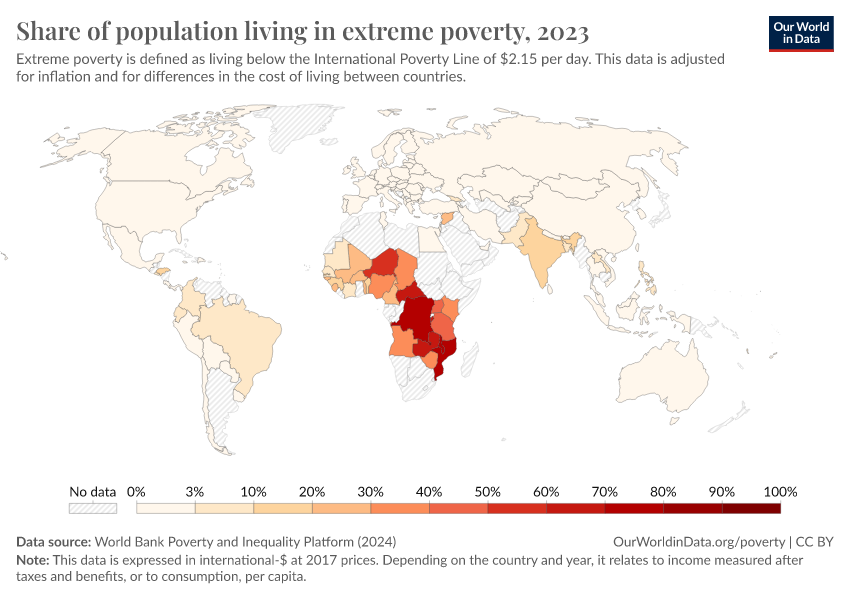
Share of population living in extreme povertyWorld Bank

Life expectancy at birthLong-run estimates collated from multiple sources by Our World in Data

Per capita CO₂ emissionsLong-run estimates from the Global Carbon Budget

GDP per capitaLong-run estimates from the Maddison Project Database

Share of people that are undernourishedFAO

Literacy rateLong-run estimates collated from multiple sources by Our World in Data

Share of the population with access to electricityWorld Bank

Data explorers

See all our Data Explorers

Interactive visualization tools to explore a wide range of related indicators.

Subscribe to our newsletters

Receive our latest work by email.
By subscribing you are agreeing to the terms of our privacy policy.

All our topics

All our data, research, and writing — topic by topic.

Population and Demographic Change

Health

Energy and Environment

Food and Agriculture

Poverty and Economic Development

Education and Knowledge

Innovation and Technological Change

Living Conditions, Community and Wellbeing

Human Rights and Democracy

Violence and War