Data

Distribution of democracy index

See all data and research on:

About this data

Distribution of democracy index
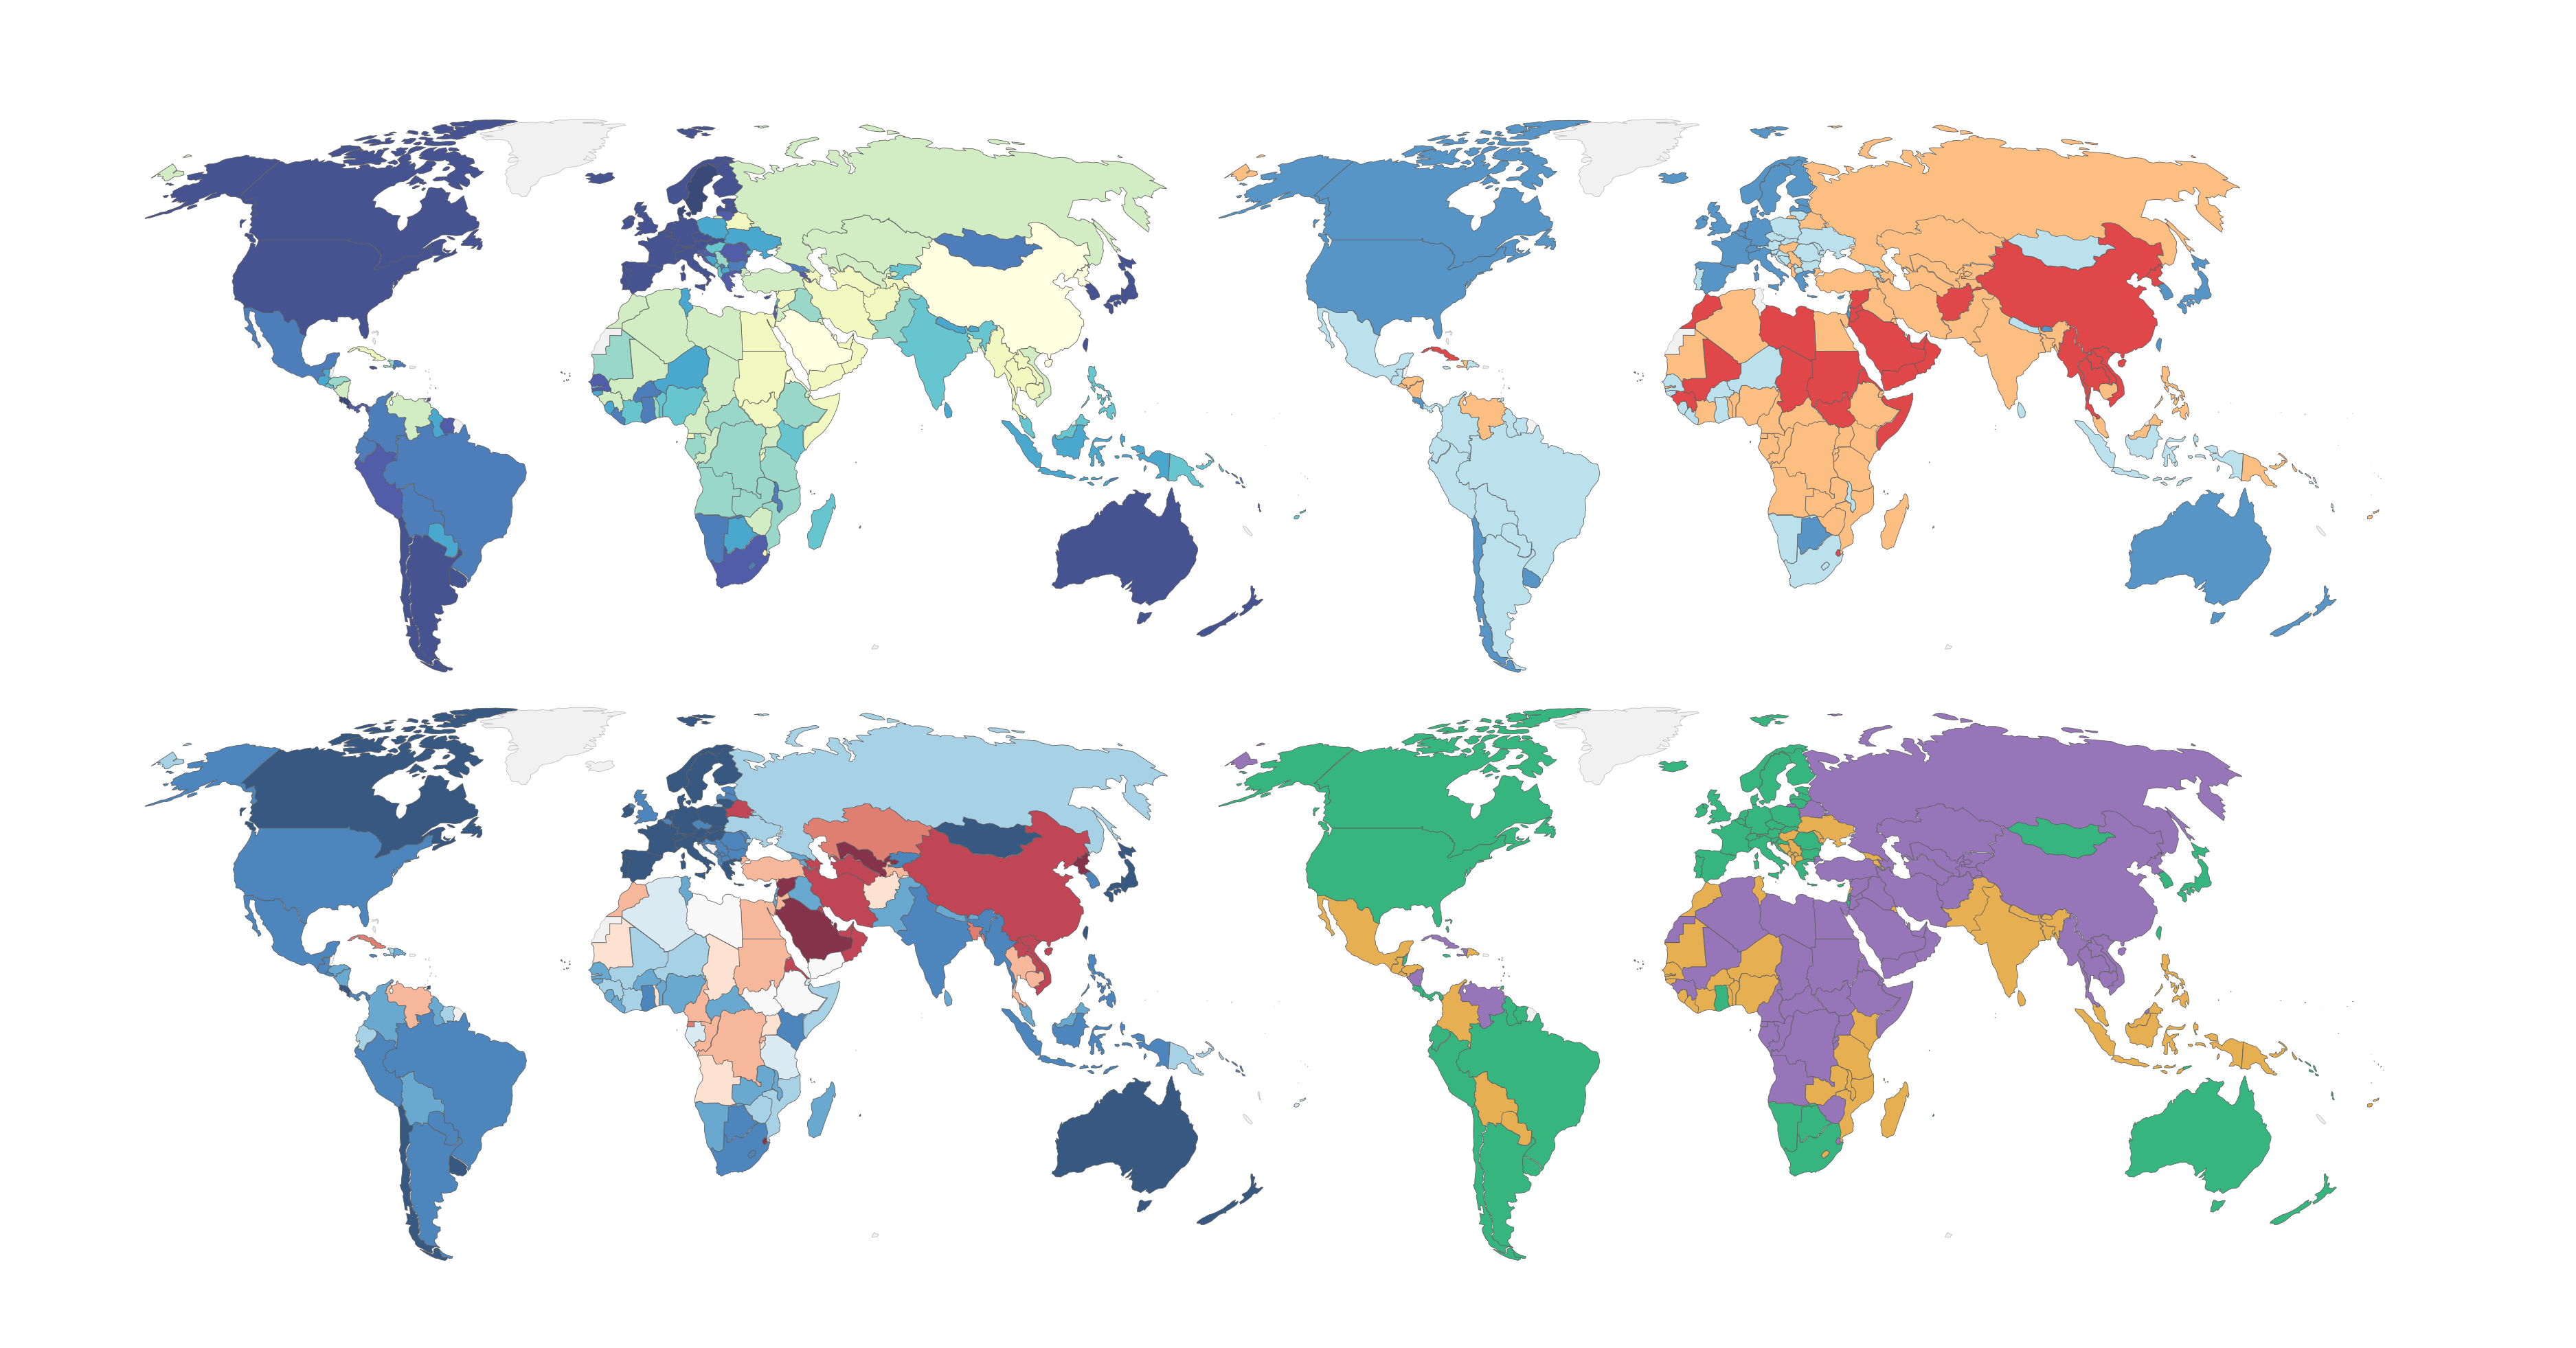
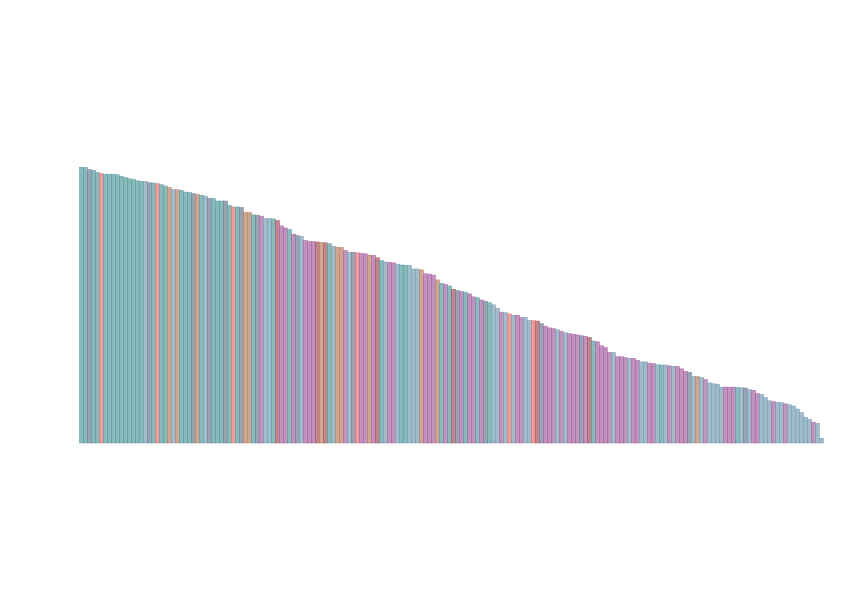
It combines information on the extent to which open, multi-party, and competitive elections choose a chief executive who faces comprehensive institutional constraints, and political participation is competitive. It ranges from 0 to 20 (fully democratic).
Source
Polity 5 (2020) – processed by Our World in Data
Last updated
May 13, 2024
Next expected update
May 2025
Date range
1776–2020

Sources and processing

This data is based on the following sources

The Polity5 project continues the Polity research tradition of coding the authority characteristics of states in the world system for purposes of comparative, quantitative analysis. The original Polity conceptual scheme was formulated and the initial Polity I data collected under the direction of Ted Robert Gurr and informed by foundational, collaborative work with Harry Eckstein, Patterns of Authority: A Structural Basis for Political Inquiry (New York: John Wiley & Sons, 1975). The Polity project has proven its value to researchers over the years, becoming the most widely used resource for monitoring regime change and studying the effects of regime authority. The Polity project evolved through three earlier research phases, all under the direction of Ted Gurr. The Polity III phase updated core Polity data through 1992 and was later updated through 1998 and released as the Polity98 version. Through its evolution, the format of the Polity data has been transformed from its original focus on “persistence and change” in the “polity” as the unit of analysis (i.e., politycase format) to its present country-year case format. The original Polity I format was revisited by a research team under the direction of Nils Petter Gleditsch and information concerning the dates of coded polity changes was updated in 1994 and made available in the original polity-case format as Polity IIId. In the late 1990s, Polity became a core data project in the State Failure Task Force global forecasting project. The special focus on “state failure” problem events within a general context of societal and systemic development processes requires information pertinent to both Polity foci, state continuity and change (country-year format) and regime persistence and change (polity-case format), be combined in a single data resource base. The Polity IV combined format version was instituted with the 2000 data update.

Retrieved on
May 13, 2024
Citation
This is the citation of the original data obtained from the source, prior to any processing or adaptation by Our World in Data. To cite data downloaded from this page, please use the suggested citation given in Reuse This Work below.
Marshall, Monty G. and Ted Robert Gurr. 2020. Polity 5: Political Regime Characteristics and Transitions, 1800-2018. Center for Systemic Peace.

How we process data at Our World in Data

All data and visualizations on Our World in Data rely on data sourced from one or several original data providers. Preparing this original data involves several processing steps. Depending on the data, this can include standardizing country names and world region definitions, converting units, calculating derived indicators such as per capita measures, as well as adding or adapting metadata such as the name or the description given to an indicator.

At the link below you can find a detailed description of the structure of our data pipeline, including links to all the code used to prepare data across Our World in Data.

Read about our data pipeline
Notes on our processing step for this indicator

It matches the variable polity2 in Polity 5 (2021), with the values rescaled to range from 0 to 20 instead of -10 to 10. Values for continents have been obtained by averaging the values of the countries in the continent.

Reuse this work

  • All data produced by third-party providers and made available by Our World in Data are subject to the license terms from the original providers. Our work would not be possible without the data providers we rely on, so we ask you to always cite them appropriately (see below). This is crucial to allow data providers to continue doing their work, enhancing, maintaining and updating valuable data.
  • All data, visualizations, and code produced by Our World in Data are completely open access under the Creative Commons BY license. You have the permission to use, distribute, and reproduce these in any medium, provided the source and authors are credited.

Citations

How to cite this page

To cite this page overall, including any descriptions, FAQs or explanations of the data authored by Our World in Data, please use the following citation:

“Data Page: Distribution of democracy index”, part of the following publication: Bastian Herre, Lucas Rodés-Guirao, Esteban Ortiz-Ospina and Max Roser (2013) - “Democracy”. Data adapted from Polity 5. Retrieved from https://ourworldindata.org/grapher/distribution-democracy-index-polity [online resource]
How to cite this data

In-line citationIf you have limited space (e.g. in data visualizations), you can use this abbreviated in-line citation:

Polity 5 (2020) – processed by Our World in Data

Full citation

Polity 5 (2020) – processed by Our World in Data. “Distribution of democracy index” [dataset]. Polity 5, “Polity5 Project, Political Regime Characteristics and Transitions, 1800-2018 5” [original data]. Retrieved June 7, 2024 from https://ourworldindata.org/grapher/distribution-democracy-index-polity